- Home >
- Stock Photos >
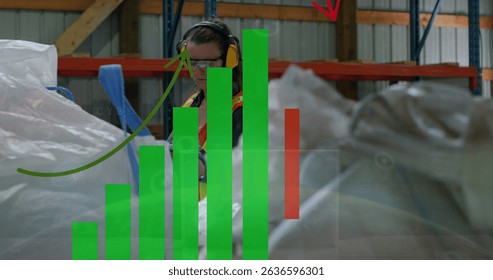
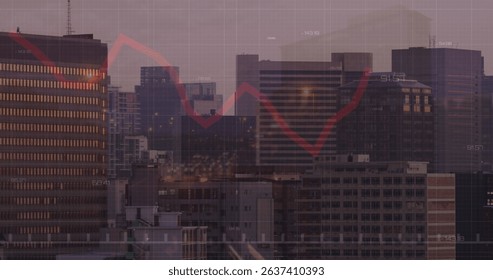
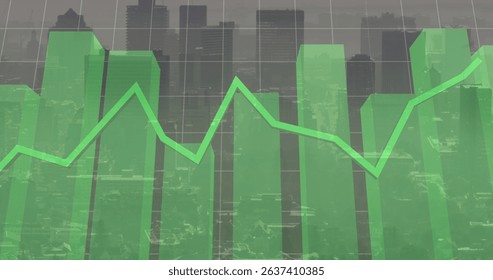
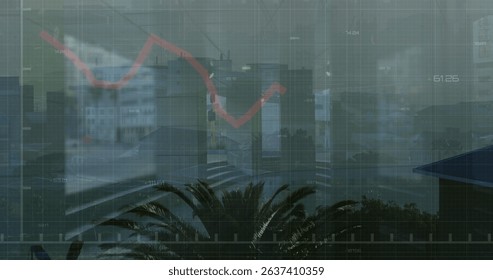
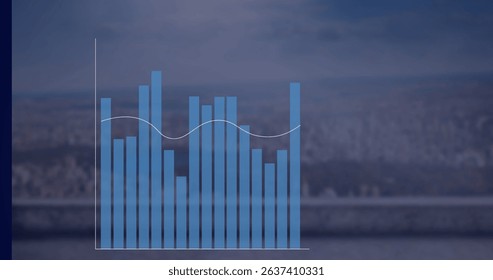
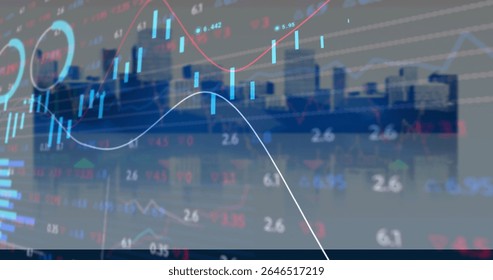
- Dynamic Financial Graphs Illustrating Market Trends
Dynamic Financial Graphs Illustrating Market Trends Image

Illustrates complex financial data visualized as overlapping graphs on dark background, indicating market fluctuations. Useful for financial presentations, reports, or investment analyses, emphasizing data-driven insights and economic strategies.
Powered by  - Get 15% off with code: PIKWIZARD15


2
downloads
downloads
Tags:
More
Credit Photo
If you would like to credit the Photo, here are some ways you can do so
Text Link
photo Link
<span class="text-link">
<span>
<a target="_blank" href=https://pikwizard.com/photo/dynamic-financial-graphs-illustrating-market-trends/73b4ca85c095f8d7b6d6fbc8823b90df/>PikWizard</a>
</span>
</span>
<span class="image-link">
<span
style="margin: 0 0 20px 0; display: inline-block; vertical-align: middle; width: 100%;"
>
<a
target="_blank"
href="https://pikwizard.com/photo/dynamic-financial-graphs-illustrating-market-trends/73b4ca85c095f8d7b6d6fbc8823b90df/"
style="text-decoration: none; font-size: 10px; margin: 0;"
>
<img src="https://pikwizard.com/pw/medium/73b4ca85c095f8d7b6d6fbc8823b90df.jpg" style="margin: 0; width: 100%;" alt="" />
<p style="font-size: 12px; margin: 0;">PikWizard</p>
</a>
</span>
</span>
Free (free of charge)
Free for personal and commercial use.
Author: People Creations
Similar Free Stock Images

Premium


Premium


Premium


Premium


Premium


Premium


Premium


Premium


Premium


Premium


Premium


Premium


Premium


Premium


Premium


Premium


Premium


Premium


Premium


Premium


Premium


Premium


Premium


Premium


Premium