1. Home > 
  2. Stock Photos > 
  3. Dynamic Financial Graphs on Dark Digital Background

Dynamic Financial Graphs on Dark Digital Background Image

Dynamic Financial Graphs on Dark Digital Background

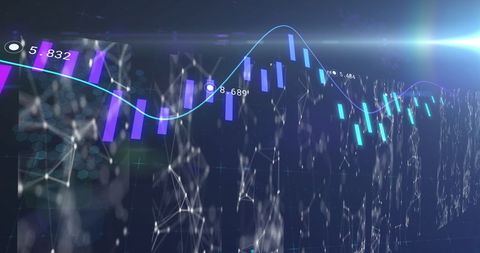
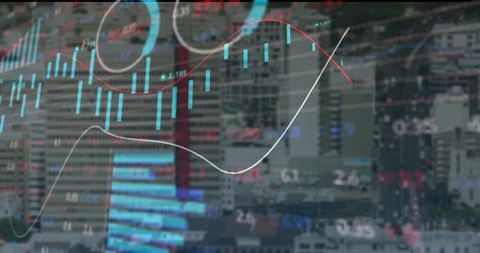
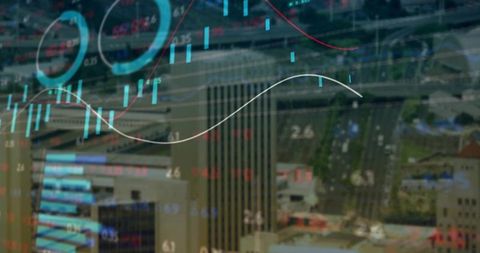
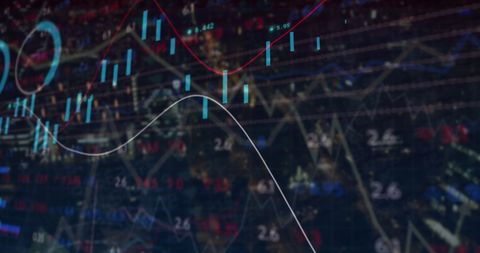
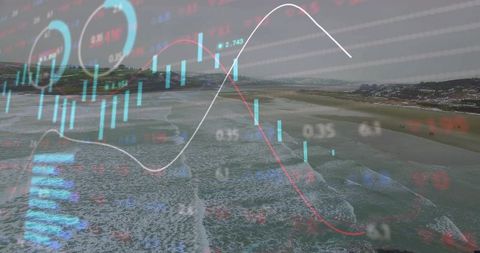
The image shows dynamic financial graphs and data superimposed on a navy background, representing the interconnected world of finance and technology. This portrayal of fluctuating lines and numbers is ideal for use in technology-focused articles, financial reports, or presentations about stock market trends and economic forecasts.

Powered by Adobe logo
Stock market investment trading graph growth Transparent.Trade business analytics graph and financial chart.PNG chart graph business.	 - Powered by AdobeFinancial market data analysis with glowing 3D bar and line charts on dark background showing economic trends and growth concept visualization. 3D Rendering - Powered by AdobeGrowth chart business strategy up arrow graph finance stock market or increase money profit diagram on financial concept success economy investment background with digital . - Powered by AdobeReflection of financial numbers and graph on glass globe - Powered by AdobeGold investment stock market diagram concept isolated on 3d background with business financial economy trade wealth banking chart. Growth marketing forex money finance currency success profit graph - Powered by Adobe

Credit Photo

If you would like to credit the Photo, here are some ways you can do so

Free (free of charge)

Free for personal and commercial use.

Author: Authentic Images

Similar Free Stock Images

Loading...
Cityscape Background with Abstract Finance Data Overlay
Premium
Two glowing spheres with financial graphs inside balance on a seesaw, representing comparison and equilibrium in data or market analysis.
Digital Data Analytic Overlay on Urban Architecture
Abstract Financial Graphs Overlaid on Futuristic Cityscape
Premium
ESG, Environment and Investment Green plants growing in front of financial graphs and charts.
Abstract Digital Data Streams and Cyber Patterns
Financial Data Visualization with Statistics and Graphs
Analytics and Stock Market Trends with Urban Skyline
Digital Financial Data Showing Trending Graphs in Transparent Overlay
Digital Data Waveforms on Multiple Computer Interfaces
Financial Data Analytics Conceptual Overlaid with Cityscape
Advanced Financial Data Processing and Analysis Interface
Abstract Financial Graphs Overlapping Urban Cityscape Background
Digital Financial Charts Overlaying Globe Showcasing Global Economy
Cyber Security Concept with Growth Hacking Data Overlay
Futuristic Financial Data Processing Over Cityscape
Premium
Interactive Data Analysis and Forecasting. Business and finance concept.
Financial Data Monitoring Concept with Digital Vortex
Abstract Overlay of Graphs and Modern Architecture Reflecting Stock Market Trends
Dynamic Financial Data and Analysis Display
Abstract Digital Graph with Trend Lines and Data Points
Premium
Trade business analytics graph and financial chart investment. Stock market investment trading graph and crypto currency.
Abstract Representation of Financial Data and Charts
Dynamic Stock Market Charts and Financial Data Representation
Digital Finance Interface Display with Data Visualization
Stock Market and Financial Graphs Overlay on Urban Background
Digital HUD Display with 5G Network and Data Processing Graphics
Premium
Crop trader using smartphone and working with binary option
Innovative Stock Market Data with Candlestick Chart and Trendline
Financial Data Overlaid on Rural Horizon at Dusk
Financial Data Fluctuating on Modern Digital Dashboard Interface
Cityscape Merged with Dynamic Financial Data Visualization
Conceptual Cyber-Financial Data Over High-Tech Urban Background
Digital Financial Data Graph Overlay Cityscape
Dynamic Financial Data Graphs Overlay Cityscape
Futuristic Financial Security Illustration with Graphs and Cityscape
Global Finance Concept with Digital Graphs and Cityscape Effect
Digital Financial Data and Technology Visualization
Digital Financial Data on Graphical Interface
Digital Overlay of Financial Data with Futuristic Charts
Premium
Data analyzing and stock market visualization with digital charts, financial dashboards, and performance metrics. Ideal for investment analysis, trading strategy, and economic forecasting.
Global Data Analytics on Digital World Map Interface
Global Financial Data Process with Digital Interface and Statistics
Digital Financial Graphs and Urban Skylines
Battery Icon Merged with Virtual Trading Graph Over Skyline
Premium
Stock market graph with blue technology background, financial trading analysis chart, investment growth data visualization, economic business concept
Neon Battery Icons Over Economic Data
Futuristic Financial Graphics with City Silhouette
Global Data Analysis with Futuristic World Map
Abstract Financial Chart Overlays on Digital City Skyline
Premium
Illustration of financial growth concept with plants, charts, and graphs on a white background, symbolizing business and investment.
Global Financial Data Visualization with Inspirational Theme
Digital Financial Data and Analytics Concepts with Graphs
Digital Data Interface with Financial Buildings Overlay
Financial Data Analysis and Cityscape Merge
Premium
Blue growth graph business chart data diagram on success financial presentation background
Business Silhouettes with Digital Stock Market Overlays
Financial Data Analysis with Urban Skyline Double Exposure
Innovative Data Analytics Interface with Dynamic Trend Curves
Premium
Golden compass on financial data chart showing stock market trading graphs. Investment strategy, financial direction, business analysis, digital technology concept with sparkling lights, blue, red
Digital Finance Analytics Overlay on Trading Floor
Translucent Financial Charts Overlaying Aerial Coastal Landscape with Candlestick Trends
Financial Data Visualization Over Cityscape Theme
Digital Data Overlay on Modern Urban Skyline
Premium
Stethoscope on glowing digital financial display with pink, blue hues. Shows market analysis, stock data, economy trends, business investment graphs. Futuristic interface with bright abstract
Digital Financial Data Processing with Futuristic Interface
Cybersecurity in Global Finance with Data Encryption
Financial Data Analysis with Illuminated Cityscape Backdrop
Digital Interface with Financial Data on World Map
Premium
Global financial market crash with downward arrow and graph on digital red grid background showing crisis and economic collapse impact concept. 3D Rendering
Premium
Abstract financial chart showing upward trend with superimposed bar and line graphs in blue hues on a light background
Digital Data Analysis in High-Tech Computer Interface
Digital Data Analytics with Graphs and Charts Overlay
Financial Data Analysis Displaying Digital Stock Market Trends
Premium
Financial downturn visualized by a falling red graph overlayed on a blurred American flag
Premium
Ai generated image of blue financial graph with upward trend isolated on transparent background
Modern Business Trends with Digital Graph Over Cityscape
Financial Data Overlay with Business Growth Charts in Modern Cityscape
Data Visualization Graphs on Digital Interface Background
Cyber Security Interface with Digital Data Scanning
Premium
Global financial prosperity
Digital Data Trends and Analytics Visualization with Bright Highlighted Points
Stock Market Analysis Overlaying Cityscape: Global Business Theme
Digital Financial Data Analysis with Graphs and Code Overlay
6G Technology with Stock Market Data Overlaying Modern Building
Premium
Abstract financial chart with bokeh
Digital Transformation in Global Finance Over Cityscape
Futuristic Data Analytics Over City Skyline
Digital Stock Market Analysis Over City Skyline
Futuristic Trading Dashboard with Analytics and Graphs
Dynamic Trading Terminal with Interactive Financial Data
Premium
A businesswoman analyzes financial documents with charts and graphs at a desk, highlighting data trends with a pen in a bright, professional office setting.
Premium
Financial growth chart with glowing line graph overlay on city skyscrapers at sunset, representing business success and economic progress.
Futuristic Digital Finance Interface Over Cityscape
Data Processing and Cityscape Fusion in Modern Business
Digital Data Analytics Over Modern Urban Architecture
Premium
Inflation and tax concept Rising inflation rates graph. Global economy recession. interest rate, business, finance and investment background. Stack of coins money with financial graph and copy space
Financial Graphs City Technology Infused Business Concept
Digital Security in Financial Technology Concept
Premium

Dynamic blue and green digital stock market graph with bar charts and lines on a dark background, representing financial data analysis, investment trends, business growth, and global economy fluctuat
Cityscape Infused with Stock Market Data and Curved Trends
Complex Financial Graphs on Navy Blue Background
Dynamic Financial Data with Graph Overlay
Global Business Networking and Data Analytics
Premium
Green arrow pointing upward on financial graph. Business growth chart with rising trend line. Digital stock market data visualization for investment analysis
Stock Market Data Overlay on Urban Cityscape
Stock Market Financial Data with Zero Percent Increase Highlight
Digital Financial Data Graphs on Dark Background
Futuristic Financial Data Visualization Background
Statistical Stock Market Data with Night City Traffic Overlay
Premium
Magnifying glass focusing on candlestick chart, showcasing market analysis on a dark background, concept for financial review, investment strategy and business intelligence data analysis
Abstract Financial Graphs Overlaying a Futuristic City Skyline
Financial Data Analysis with Graphs and Statistics Visualization
Stock Market Trends with Modern Cityscape Overlay
Financial Data Processing Over Modern City Skyline
Premium
Businessman analyzing financial data on futuristic digital screen with graphs and charts on a dark background, showcasing the finance growth concept.
Digital Financial Data Processing in Global Market Environment
Abstract Financial Data and Technology Overlay with Global Analysis
Digital Interface with Financial Data Overlays on Cityscape
Premium
Abstract representation of financial growth with glowing graphs and data patterns in dark background
Finance Data Visualization with Cityscape Overlay
Financial Data Visualization with Urban Background
Dynamic Financial Charts Overlaying Urban Skyline for Analytical Insights
Digital Market Data Overlay on Vibrant Metropolis Scene
Global Market Analytics Dashboard Showing Candlestick Charts, Line Graphs, Moving Averages