
- Home >
- Stock Photos >
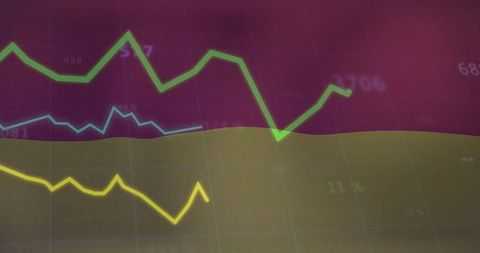
- Dynamic Financial Graphs on Gradient Red Background
Dynamic Financial Graphs on Gradient Red Background Image

Bright and engaging visualization of financial data with line and bar charts against a red gradient background. Ideal for use in presentations or reports focusing on market trends, business analytics, stock market data, or economic forecasts. Can effectively communicate a message about performance monitoring or investment strategies in a sleek digital interface format.
Powered by 


downloads
Tags:
More
Credit Photo
If you would like to credit the Photo, here are some ways you can do so
Text Link
photo Link
<span class="text-link">
<span>
<a target="_blank" href=https://pikwizard.com/photo/dynamic-financial-graphs-on-gradient-red-background/32bf9b34130a007eb0473ee19439c19c/>PikWizard</a>
</span>
</span>
<span class="image-link">
<span
style="margin: 0 0 20px 0; display: inline-block; vertical-align: middle; width: 100%;"
>
<a
target="_blank"
href="https://pikwizard.com/photo/dynamic-financial-graphs-on-gradient-red-background/32bf9b34130a007eb0473ee19439c19c/"
style="text-decoration: none; font-size: 10px; margin: 0;"
>
<img src="https://pikwizard.com/pw/medium/32bf9b34130a007eb0473ee19439c19c.jpg" style="margin: 0; width: 100%;" alt="" />
<p style="font-size: 12px; margin: 0;">PikWizard</p>
</a>
</span>
</span>
Free (free of charge)
Free for personal and commercial use.
Author: People Creations
Similar Free Stock Images

Premium

Premium

Premium


Premium

Premium


Premium


Premium


Premium


Premium


Premium

Premium


Premium


Premium


Premium


Premium


Premium


Premium


Premium


Premium


Premium


Premium


Premium


Premium


Premium


Premium

Explore More Free Stock Images