1. Home > 
  2. Stock Photos > 
  3. Dynamic Financial Graphs over Cityscape Conveying Global Markets

Dynamic Financial Graphs over Cityscape Conveying Global Markets Image

Dynamic Financial Graphs over Cityscape Conveying Global Markets

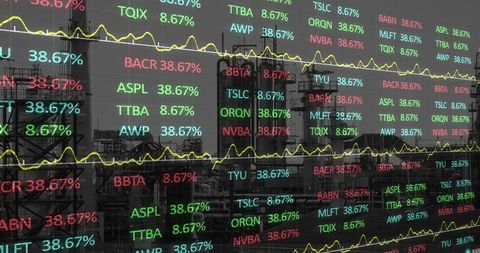
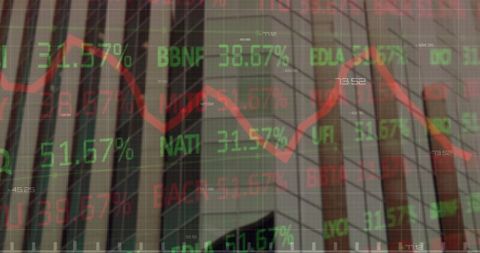
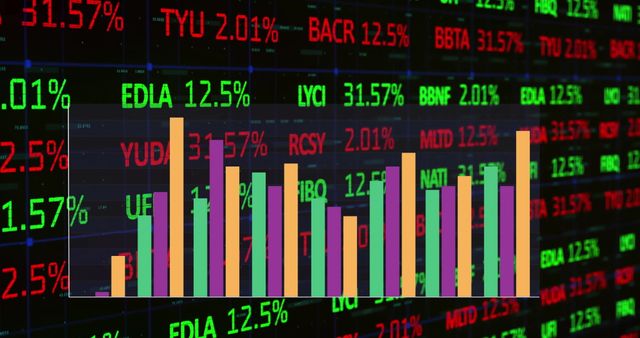
Dynamic graphical representation of financial data overlaying a cityscape, illustrating global market trends and technological integration in finance. Useful for depicting concepts in global business, economics, digital innovation, and technology-fueled financial analysis. Ideal for educational materials, presentations on investment and economic studies, and promotional or informational content targeting professionals in finance and related fields.

Powered by Adobe logo
Analyze vibrant stock trends with glowing neon graphs for modern business solutions and data visualization, financial insights, and investment strategies success - Powered by AdobeFinancial market data analysis with glowing 3D bar and line charts on dark background showing economic trends and growth concept visualization. 3D Rendering - Powered by AdobeAbstract Financial Data Visualization with Red Stock Market Chart and Blue Digital Background for Business Analysis and Economic Forecasting - Powered by AdobeFuturistic digital financial data chart with glowing blue and pink bar graphs and line charts visualizing big data analytics, statistics, and stock market performance on a dark background - Powered by AdobeBusinessman analyzing financial data with stock market charts and candlestick graphs on a digital screen - Powered by Adobe

Credit Photo

If you would like to credit the Photo, here are some ways you can do so

Free (free of charge)

Free for personal and commercial use.

Author: People Creations

Similar Free Stock Images

Loading...
Global Financial Data with World Map Background
Premium
A businessman uses a digital tablet to analyze financial graphs and stock market data against a city skyline, reflecting trends and growth strategies in the modern economy. Scalp
Digital Stock Market Tickers Over Modern Urban Scene
Digital Interface with Financial Data Displayed on Screen
Digital Data Visualization with Dynamic Financial Charts and Graphs
Futuristic Digital Financial Data Analysis
Premium
Digital financial market analysis displaying global stock exchange trends with glowing candlestick and line graphs for investment data visualization.
Solar Panels and Financial Data Visualization
Financial Data with World Map Overlay Illustrating Global Business Trends
Finance Data Charts with Multiple Percent Indicators
Dynamic Display of Financial Data Patterns and Numbers
Premium
Abstract representation of financial growth with glowing graphs and data patterns in dark background
Abstract Digital Dashboard with Stock Market Data Visualization
Stock Market Graphs and Battery Icon Concept
Global Stock Market Trends with Digital World Map Overlay
Dynamic Trading Board with Financial Graphs and Urban Landscape
Premium
Abstract financial stock market graph with candlestick bars isolated on transparent background
Stock Market Tickers with Digital Graphics Overlay
Dynamic Trading Board with Graph Overlay on Cityscape
Dynamic Stock Market Analysis Overlaid on Cityscape
Financial Data Displays with Historical Stock Market Trends
Global Economy and Stock Market Digital Data Interface
Premium
stock market visual metaphor concept. A crystal ball displaying financial graph trends on a dark cushion.
Digital Trade Data with Stock Market Analysis Connections
Globe Overlay on Stock Market Graphs Global Financial Data
Stock Market Data Visualization with Trend Lines
Premium
Dynamic digital financial graph with glowing purple and blue trend lines on dark background displaying market analytics data for investment technology
Premium
A businesswoman analyzes stock market trends using graphs and data visualization on her laptop in a modern office setting. Focus on financial metrics and technology integration. Scalp
Financial Data Processing Over Cityscape Concept
Financial Data Display Overlaid on Office Skyscraper
Financial Data Overlay with Cityscape for Global Business Analysis
Stock Market Data on Dynamic Digital Display with Financial Graphs
Financial Growth Displayed Over urban Panorama
Premium
Data analyzing and stock market visualization with digital charts, financial dashboards, and performance metrics. Ideal for investment analysis, trading strategy, and economic forecasting.
Dynamic Visualization of Stock Market Data Against Cityscape
Premium
Dynamic stock market chart with vibrant blue and pink bars showing upward trend and financial data visualization in a futuristic digital interface
Global Stock Market with World Map and Digital Data Interface
Digital Financial Data with Rising Trends Display
Composite of Construction Site and Financial Market Data
Premium
Digital visualization of financial growth with rising bar graphs and glowing data points
Close-up of Digital Stock Market Data Trends
Transparent Stock Market Chart Highlighting Financial Trends
Digital Data Trends Overlaying Cityscape Indicating Business Growth
Financial Data Screen Displaying Stock Market Tickers and Graph
Premium
Digital glowing stock market chart with options trend and index data on a dark background, symbolizing economic growth, trading, and financial technology.
Stock Market Data Displayed on Modern Digital Screen Overlay
Financial Data Analysis with Digital Graphs in Modern Office
Dynamic Stock Market Graph on Digital Grid Background
Dynamic Stock Market Graphs on Digital Screen with Cityscape in Background
Premium
Glowing stock market chart with rising arrow symbolizing investment success and data insights
Financial Data Analysis with Digital Overlay Shows Global Trends
Global Digital Network with Financial Data Display
Digital Stock Market Interface with Financial Data Overlay
Digital Display of Global Financial Data on World Map
Premium
A focused individual analyzes digital financial data on a futuristic interface, highlighting trends and insights with a finger gesture.
Financial Data Processing with Cityscape Overlay
Dynamic Stock Market Graphs with Green and Red Digits
Digital Stock Market Data with Network Grid Overlay
Global Financial Data on Stock Market Display
Premium
Analyzing Financial Trends With KPI Data
Digital Stock Market Data Projection on Office Building
Digital Financial Ticker Display Showing Live Stock Exchange Data
Stock Market Data Graphics on Modern Building Background
Financial Data Technology Display Over Cityscape
Navigating Stock Market Trends through Digital Analytics
Dynamic Stock Market Data Overlay Against City Night Scene
Financial Market Data Display with Digital Interface Graphics
Digital Display of Stock Market Data Trends
Digital Stock Market Data on Glowing Screens Panel
Global Financial Data Overlaying World Map
Global Financial Market Trends with Digital World Map overlay
Premium
Futuristic digital financial market data visualization with glowing blue and pink bar charts and line graphs on a dark background
Global Financial Data Streaming Over World Map
Financial Data Graph Representation with Pink Overlay
Glowing Stock Market Data and Interactive Graphs in Office
Digital Financial Data Overlay with World Map
Premium
Abstract data visualization of financial market trends.  Dynamic display of stock market analysis
Financial Data with Innovative Digital Payment Interaction
Stock Market Data Overlaying Urban Skyline Wall Street Innovation
Digital Stock Market Display with Graphs Analysis
Dynamic Stock Market Trends with Fluctuating Chart Lines
Premium
Dynamic digital data visualization showing market stock analysis and financial growth trend
Digital Data Analysis for Global Business Platforms
Spinning Globe with Stock Market Data on Digital Background
Global Stock Market Exchange with Dynamic Data Display
Futuristic Stock Market Data with Digital Connections
Premium
Analyzing stock market trends on a digital tablet
Dynamic Stock Market Graph on Digital Data Screen
Globe Over Financial Data Background with Stock Exchange Graphs
Financial Stock Market Data Analyzing Business Growth Trends
Global Stock Market Data with Nature Overlay
Dynamic Digital Financial Data Display with Analytics
Premium
See the 2026 financial growth forecast with a vibrant stock market chart and dynamic data visualization for future business success and investment trends
Abstract Financial Data and Cityscape City Light Overlay
Stock Market Index Showing Financial Data and Trends
Stock Market Graph Overlay with Digital Interface Effects
Premium
An illustration of financial stock market charts and graphs, representing trends and data analysis
Global Stock Market Visualization with Data Flow and Graphs
Digital Stock Market Display with Financial Index Trends
Exhausted Businessman Analyzing Fluctuating Stock Market Data
Premium
Digital dollar sign illuminated against a dark background filled with financial graphs and data, symbolizing investment opportunities and stock market trends in modern finance
Global Financial Market Stocks Trading Conceptual Background
Global Financial Data Streams with Earth Background
Financial Data Display Over City Landscape Silhouette
Stock Market Data on Global Map Background for Financial Insights
Premium
Large screen display showing various business graphs and charts.
Blurred Currency Symbols with Trading Board Display
Abstract Financial Data Overlaid on Cityscape
Abstract Financial Stock Market Data Display with Green Graph Line
World Map Display with Dynamic Financial Data Overlay
Premium
The magnifying glass highlighting financial data and market trends on paper.
Dynamic Stock Market Data Display with Real-Time Graphs
World Financial Data Overlay on Global Map Displaying Stock Market Trends
Digital Financial Data Overlapping Urban Skyline
Premium
Glowing blue candles illustrate stock market fluctuations against a dark background, symbolizing business dynamics and investment strategies
Rolling Stock Market Data on Digital Interface
Global Stock Market Data Over World Map in Digital Display
Digitally Generated Financial Market Trends and Stock Exchange Data
Businessman Analyzing Complex Stock Market Data
Global Financial Data Visualization Concept on Black Background
Rotating Globe with Financial Data and Graphs
Digital Finance Data on Cityscape Background
Colorful Graph Overlay on Financial Stock Market Data
Premium
Businesswoman using smartphone with financial data visualization and city lights at night
DNA Helix Overlaid on Stock Market Graph Analytics