- Home >
- Stock Photos >
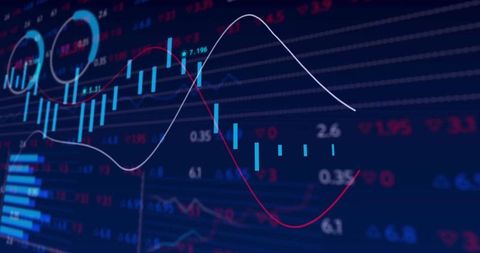
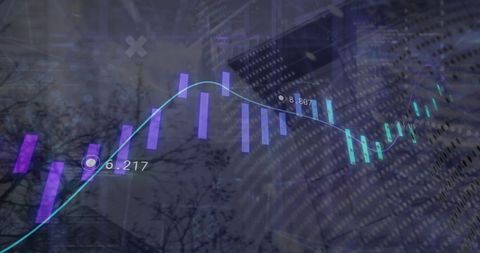
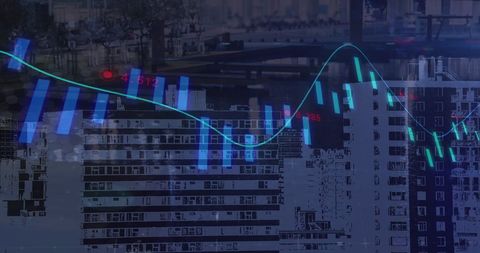
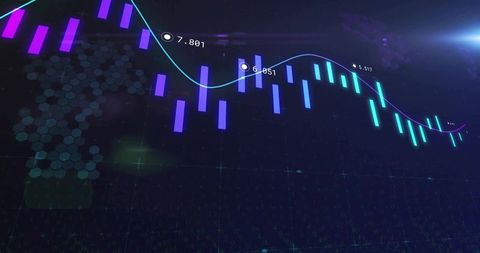
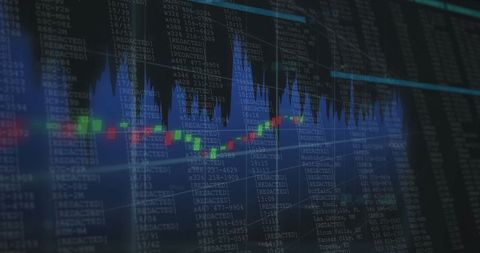
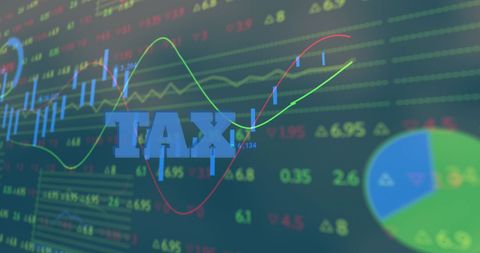
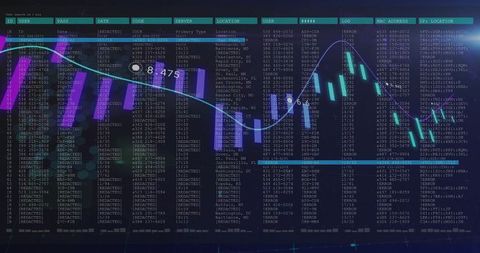
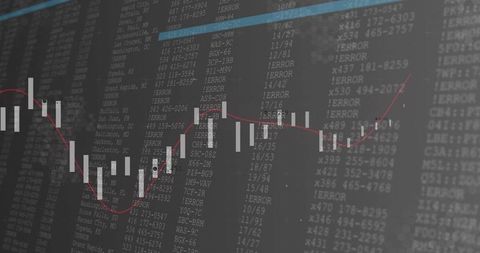
- Dynamic Financial Graphs with Candlestick Chart Overlay
Dynamic Financial Graphs with Candlestick Chart Overlay Image

An illustration showcasing dynamic candlestick charts and line graphs on a digital financial dashboard. Ideal for use in articles or presentations related to finance, trading, data analysis, fintech innovations, and investment strategies. This visualization represents market trends, making it valuable for industry reports and academic publications.

downloads
Tags:
More
Credit Photo
If you would like to credit the Photo, here are some ways you can do so
Text Link
photo Link
<span class="text-link">
<span>
<a target="_blank" href=https://pikwizard.com/photo/dynamic-financial-graphs-with-candlestick-chart-overlay/edda33b4e501e74f5fdc0a1f07b02fbd/>PikWizard</a>
</span>
</span>
<span class="image-link">
<span
style="margin: 0 0 20px 0; display: inline-block; vertical-align: middle; width: 100%;"
>
<a
target="_blank"
href="https://pikwizard.com/photo/dynamic-financial-graphs-with-candlestick-chart-overlay/edda33b4e501e74f5fdc0a1f07b02fbd/"
style="text-decoration: none; font-size: 10px; margin: 0;"
>
<img src="https://pikwizard.com/pw/medium/edda33b4e501e74f5fdc0a1f07b02fbd.jpg" style="margin: 0; width: 100%;" alt="" />
<p style="font-size: 12px; margin: 0;">PikWizard</p>
</a>
</span>
</span>
Free (free of charge)
Free for personal and commercial use.
Author: People Creations