1. Home > 
  2. Stock Photos > 
  3. Dynamic Financial Graphs with Cityscape and Global Finance Theme

Dynamic Financial Graphs with Cityscape and Global Finance Theme Image

Dynamic Financial Graphs with Cityscape and Global Finance Theme

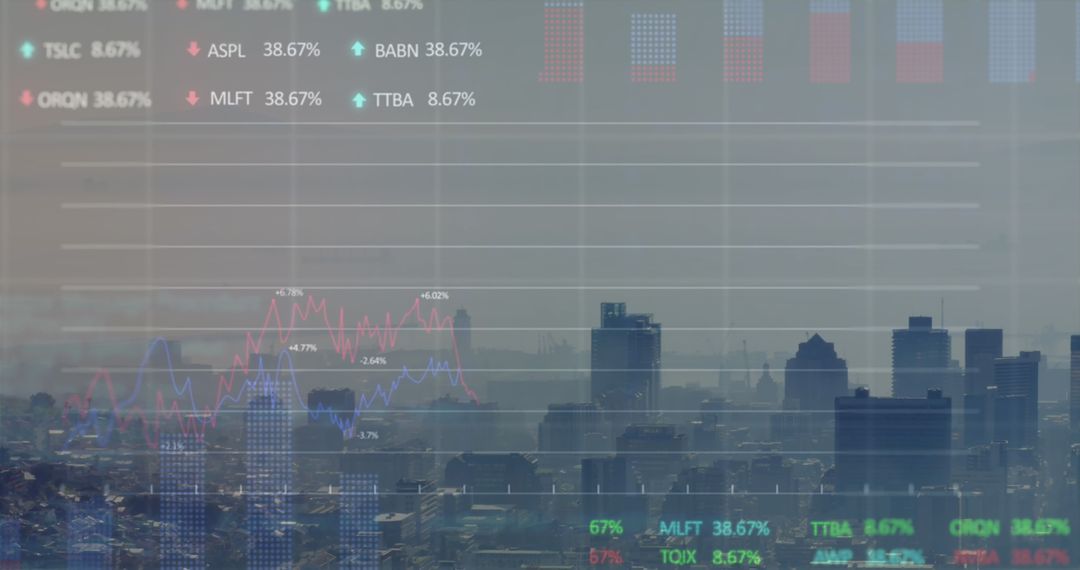
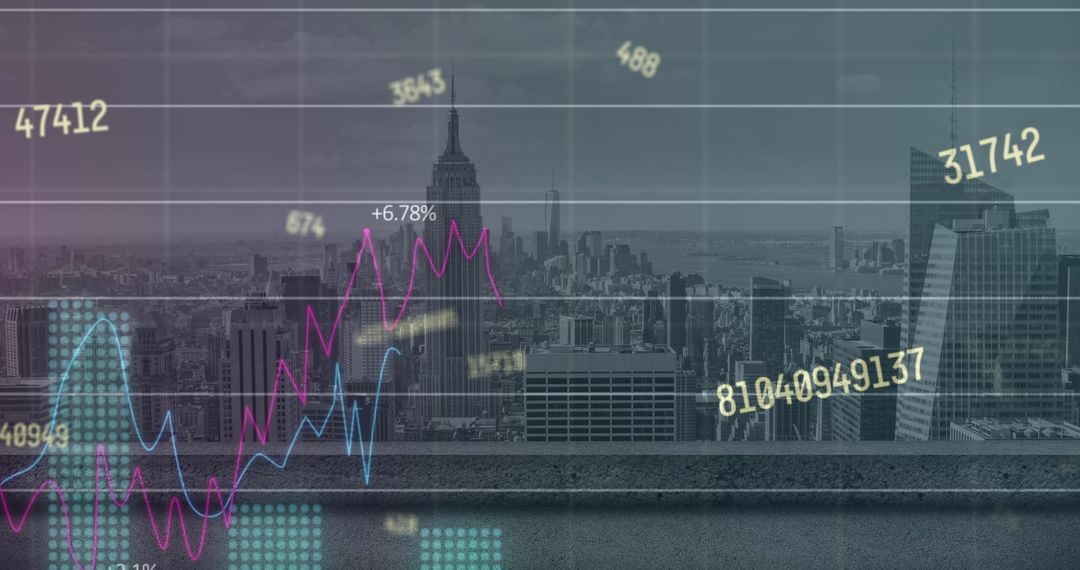
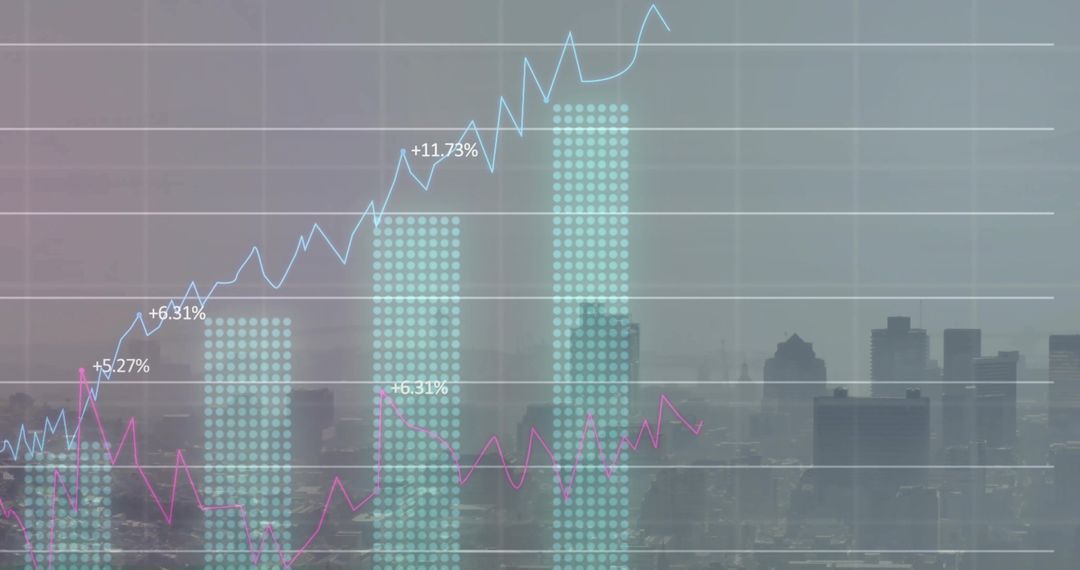
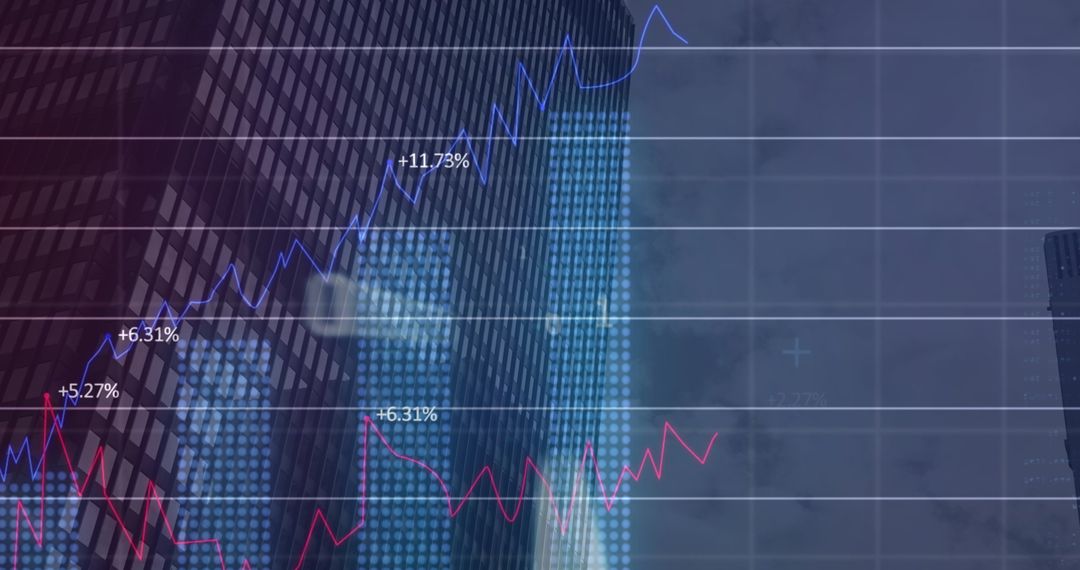
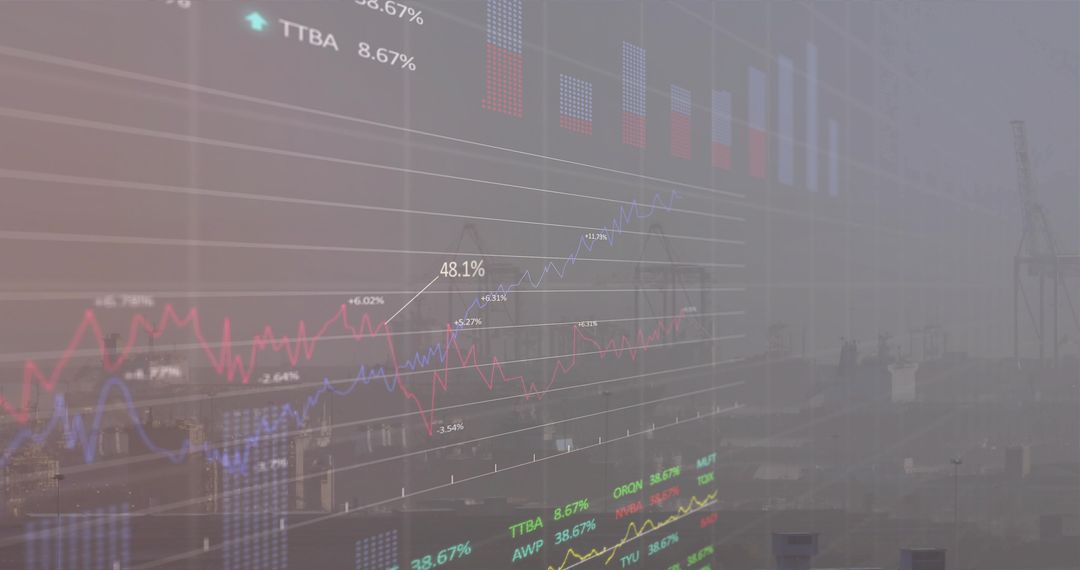
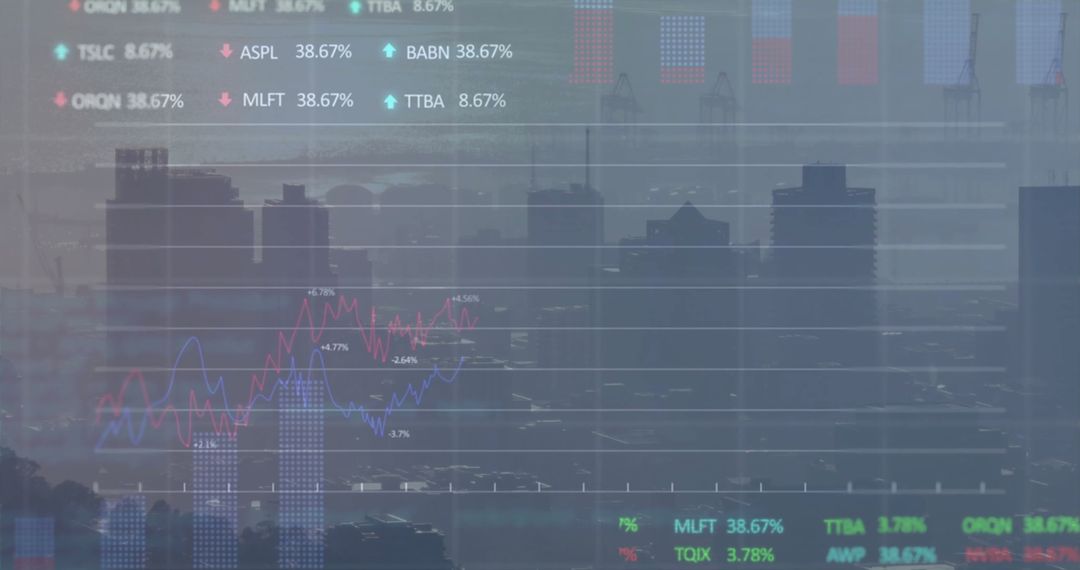
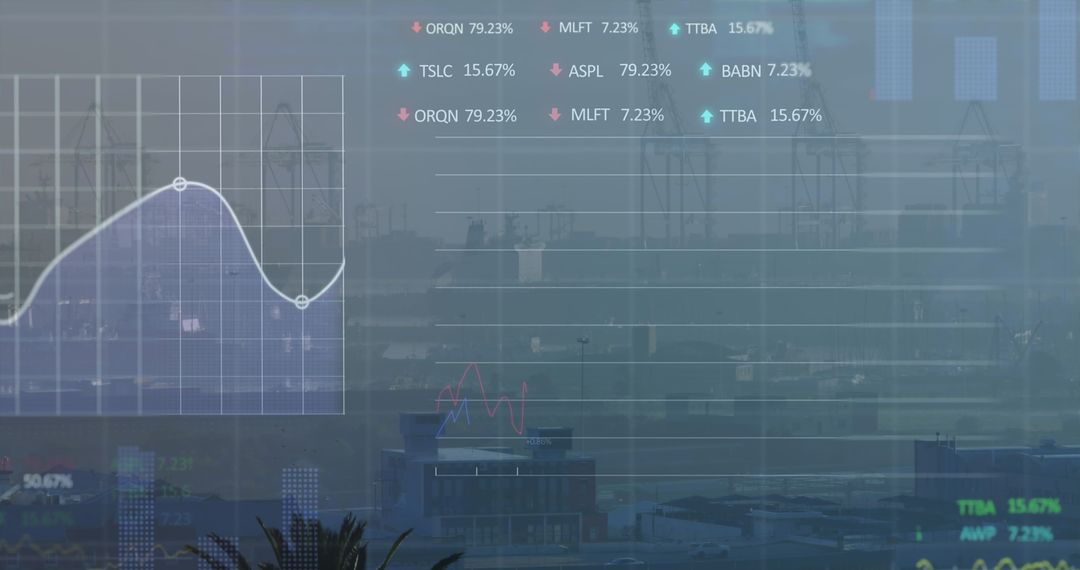
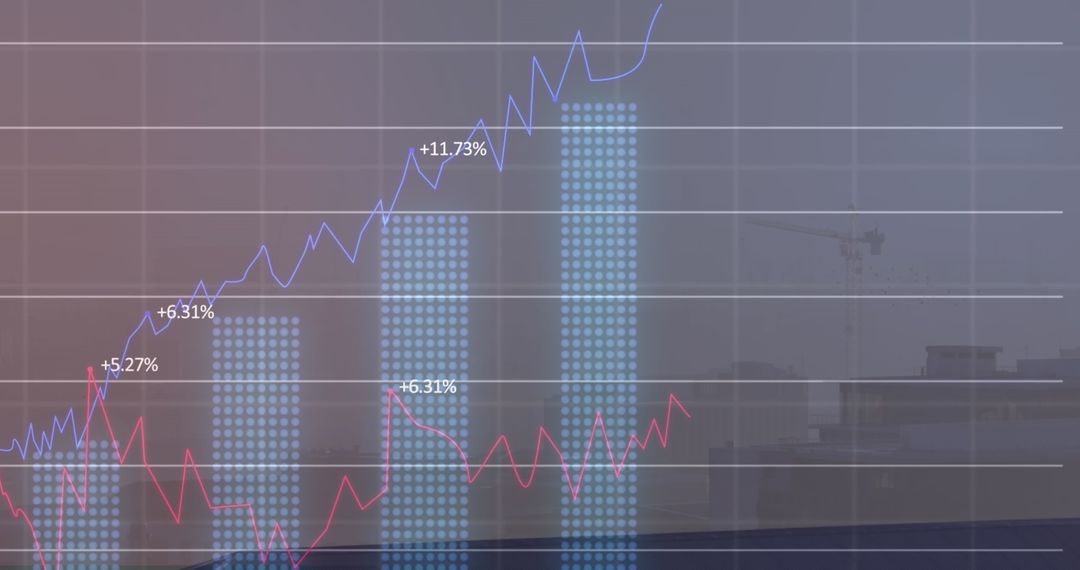
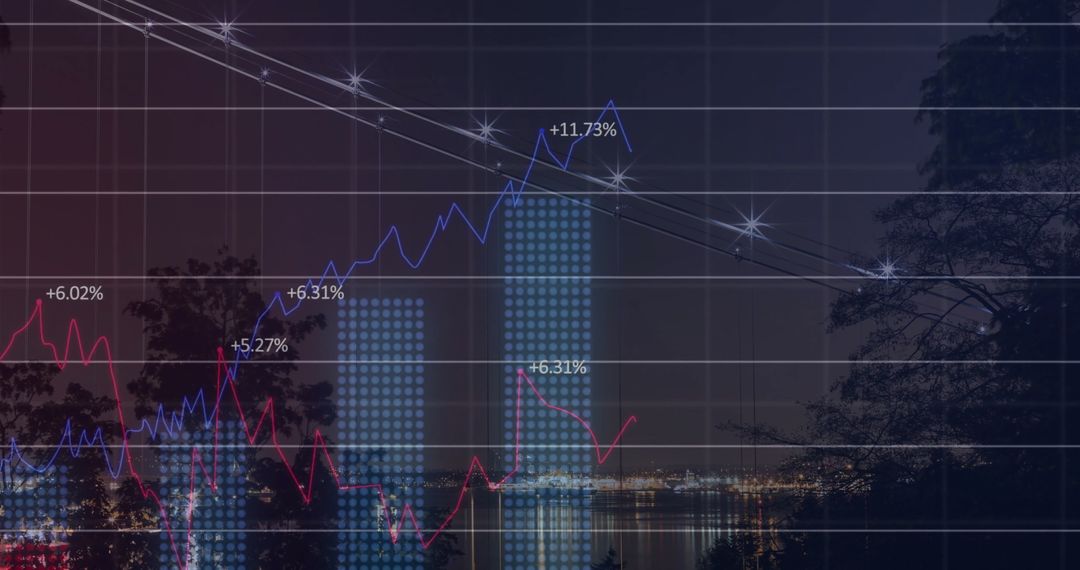
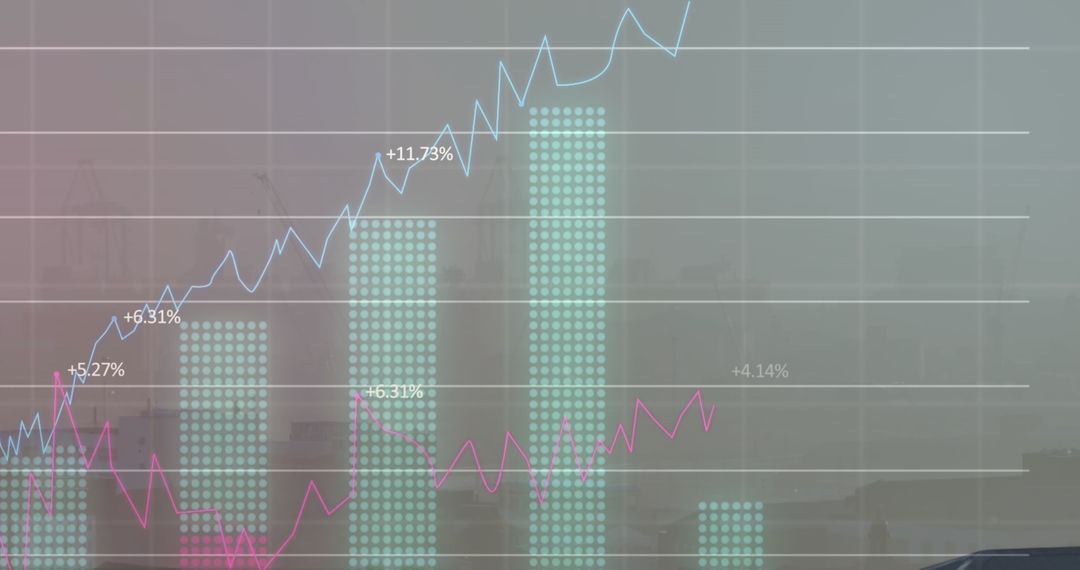
Illustration of dynamic financial graphs and data overlay a cityscape backdrop, conveying concepts of global finance and modern economy. This visually engaging composition captures the fusion of business and futuristic technology. Ideal for use in finance blogs, economic reports, investment presentations, and business analytics materials to depict advanced financial trends and global market dynamics.

Powered by Adobe logo
Night cityscape with illuminated skyscrapers and financial stock market chart overlay showing global trade data and growth trends in economy. - Powered by AdobeBusiness person analyzing financial graphs, symbolizing market growth, investment strategies, and economic development. Concepts of stock trends, Corporate finance, future planning, and data analytics - Powered by Adobeforex trade market concept with digital indicators graphs financial diagram at night kuala lumpur city background double exposure no logos no brands ar 169 - Powered by AdobeCityscape with Futuristic Financial Graph Overlay at Night Skyline View - Powered by AdobeCityscape Blurred Background with Holographic Charts and Graphs: Embracing Technology in Business - Powered by Adobe

Credit Photo

If you would like to credit the Photo, here are some ways you can do so

Free (free of charge)

Free for personal and commercial use.

Author: Authentic Images

Similar Free Stock Images

Digital Financial Data Stream with Numeric Overlay
Premium
Magnifying glass is focused on a dollar sign. The dollar sign is surrounded by a cityscape
Dynamic Financial Data Displayed Over Cityscape Background
Financial Data overlay on Cityscape with Rising Graphs
Digital Financial Data Processing Over City Skyline
Abstract Financial Graphs Overlapping Urban Skyline
Premium
Futuristic cityscape displays global stock market charts and data overlays, showcasing financial technology and urban finance concepts.
Diverse Team Analyzing Financial Digital Data in Conference Room
Digital Graphs Overlaying Urban Skyline and Clouds
Financial Graphs Over Cityscape Reflecting Economic Trends
Digital Finance Technology with Global Interconnection
Premium
Digital business charts showing financial data visualization
Rising Financial Graphs Overlaying Industrial Junkyard Scene
Futuristic Digital Interface with Cityscape and Data Analysis Overlay
Futuristic Cityscape with Data Interface Overlay
Stock Market Trends and Data Analysis over Digital Grid
Premium
Abstract cityscape overlaid with financial data, showing city lights and stock charts
Financial Data Analytics Over NY Cityscape, Digital Trends Display
Digital Stock Market Display Over Cityscape
Financial Data Integration with Urban Cityscape
Finance and Technology Theme with Stock Market Data Overlay
Premium
Abstract financial growth chart showing global market data analysis and futuristic digital trends background
Financial Data Graphs Overlaying Urban Skyline
Cityscape with Digital Data Overlay Chest
Financial Data Analysis and Global Market Trends
Digital Data Interface with Global Financial Statistics
Premium
Global Finance, Cityscape Sunset and Stock Market Data Overlay
Financial Data Overlay on Walking Business Professionals
Futuristic Data Visualization with Dynamic Graphs
Digital Financial Analytics with Dynamic Graphs and Code Interface
Rising Data Trends in Urban Landscape with Translucent Chart Overlay
Financial Analytics with Rising Graphs and Urban Skyline
Financial Visualization Overlooking Urban Cityscape
Premium
A financial graph is displayed over a modern building with a cityscape backdrop during sunset.
Cityscape with Financial Graph Overlay Illustrating Market Trends
Dynamic Financial Data Graph Overlaying Urban Skyline
Digital Interface Displaying Stock Market Data and Statistics
Advanced Financial Data and Stock Market Analysis Background
Premium
Business analysis and financial analysis. Corporate data and marketing statistics. Many graphs and charts on background of tall buildings.
Abstract Stock Market Chart Against Cityscape Background
Digital Data with Financial Graphs on Global Grid
Diverse Graphs and Data Over Urban Landscape
Financial Data Displayed Over Hazy City Skyline
Premium
Glowing arrows show growth on a dark global map with stock data, symbolizing financial success and trading activity
Stock Market Graphs Overlay on City Skyline Backdrop
Digital Interface with Social Media Metrics Overlaid on Office Background
Diverse Women Collaborating with Data Visualization Overlay in Office
Digital Interface Over Cityscape with Financial Data Visualization
Premium
City skyline at sunrise, overlaid with financial data
Financial Data Visualization with Growing Business Charts
Business Professionals Analyzing Financial Trends in Office Setting
Digital Stock Market Overlay with Skyscraper Backdrop
Financial Data Chart with Rising Trends Overlaid on Cityscape Background
Premium
A nighttime cityscape blurred in the background, overlaid by a glowing, dynamic stock market graph displayed on a screen in the foreground
Dynamic Data Analytics Interface Showing Statistical Trends
Financial Charts Overlaid with Data and Trends in Abstract Display
Financial Data Processing Display Overlaid on Modern Cityscape
Financial Graph Illustrating Stock Market Growth Over Cityscape
Premium
A golden robotic hand touches a glowing digital globe, interacting with financial data, currency symbols, and stock market graphs over a blurred cityscape.
Businesswoman with Financial Chart Overlay in Modern Office
Interactive Financial Dashboard with Data Visualization and Analytics
Financial Data Visualization Overlaying Seaport with Industrial Background
Futuristic Digital Interface with City Overlay and Data Graphs
Financial Graph Data Overlay with Modern Cityscape Background
Global Data Network Processing on Digital Interface
Premium
Data center servers with cityscape view. Financial graph and dashboard interface over blur city. Global business and technology internet connection.
Financial Data Overlay on Modern Cityscape Illustrating Market Trends
Digital Interface Displaying Live Data and Networking Concepts
Digital Interface With Cityscape And Financial Data Charts
Digital Financial Analytics Over Construction Backdrop
Premium
Dynamic financial chart overlaying a vibrant cityscape at night illustrating market trends and investment opportunities in a modern urban environment
Cybercrime Threats Impacting Financial Graphs and Data Processing
Cityscape Overlaid with Financial Data Lines
City Skyline with Digital Data Overlay Depicting Financial Growth
Financial Graph with Cityscape Background Illustrating Global Business Trends
Premium
Abstract representation of financial data with blue bar charts and a yellow line graph overlaid on a blurred cityscape background
Graph Analysis with Cityscape Background Visualizing Economic Trends
Digital Data Processing Interface Technology Concept
Financial Data Analytics Amid Urban Backdrop
Digital Data Overlay with Cityscape Backdrop Illustrating Economic Trends
Premium
Sunset and stormy sea cityscape split view with financial graph overlay.
Financial Data and Urban Skyline Merging for Business Innovation
Financial Growth Chart Over Urban Cityscape, Business Data Concept
Digital Stock Market Analysis With City Background
Financial Growth Track Over Metropolitan Skyline
Premium
Data visualization displays financial charts and graphs overlaid on a blurred cityscape at night, showcasing modern business analytics.
Digital Connection Network with Global Business Data Streams
Financial Data and Cityscape at Night with Rising Graph
Abstract Landscape with Financial Data and Global Connections
Futuristic Data Interface Displayed Over Urban Skyline
Premium
Futuristic digital cityscape with glowing blue upward trend arrow and data streams symbolizing financial growth and technological advancement
Abstract Financial Analytics with Bar and Line Graphs
Global Trade Gowth Insights Amidst Shipping Landscape
Financial Data and Cityscape Background with Digital Interface
Financial Graph Overlay Against Cityscape Illustrating Market Trends
Data Projection Over Cityscape Indicating Digital Economy
Financial Growth Graph Overlay on Modern Cityscape
Premium
Traders watch stock charts on screens in modern office overlooking city skyline at night. Data analysis happens with glowing neon dashboards, complex graphs. Financial professionals monitor market
Global Digital Interface Visualizing Data Processing
Stock Market Data Overlaid on Cityscape Reflects Fluctuating Global Economy
Digital Interface of Data Processing Over Cityscape
Digital Financial Graphs Overlay Urban Skyline
Premium
A business professional interacts with digital graphs and data visualizations in a sleek urban environment. Explore insights in finance and technology. Scalp
Finance Data Visualization in Urban Cityscape Background
Global Financial Data on Digital World Map Interface
Abstract City Traffic Analytics with Data Overlay
Diverse Professionals Discussing Data Analytics
Premium
Futuristic cityscape skyline with glowing financial data charts and graphs overlayed, representing economic growth and technological advancement in a modern metropolis at dusk
Financial Graphs Overlaying Cityscape Illustrate Global Economy
Financial Data Overlay with Urban Cityscape at Dusk
Dynamic Financial Statistics Overlay on Cityscape Background
Statistical Graphs Over Cityscape Highlighting Business Growth
Premium
Financial growth illuminated by cityscape and rising stock market charts
Financial Data Analytics with City Skyline Overlay
Financial Data and Cityscape for Global Business Analysis
Futuristic Data Chart with Digital Interface Elements
Financial Charts Over Cityscape Reflecting Economic Trends
Premium
A futuristic cityscape skyline is illuminated at night, representing global finance and digital technology
Dynamic Financial Data Over Cityscape Illustrates Global Connectivity
Futuristic Stock Market Graphs on Digital Display
Dynamic Financial Data Graph Illustrating Stock Market Trends
Stock Market Dashboard with Analytics and Graphs
Premium
Abstract financial market chart with glowing data lines overlaid on a grid set against a blurred twilight cityscape with bokeh lights
Innovative Data Visualization with Digital Line Graphs Interface