- Home >
- Stock Photos >
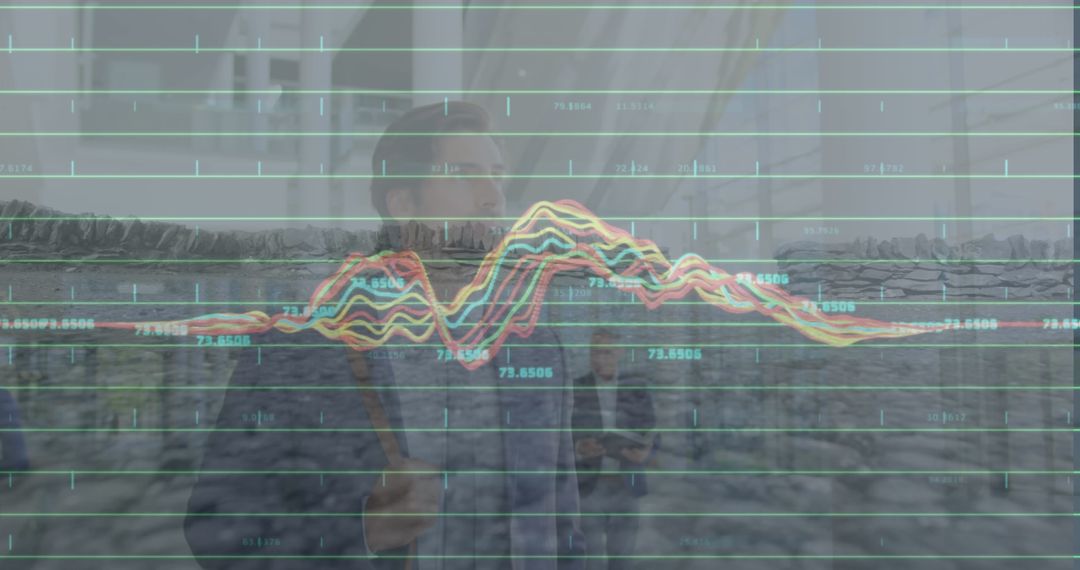
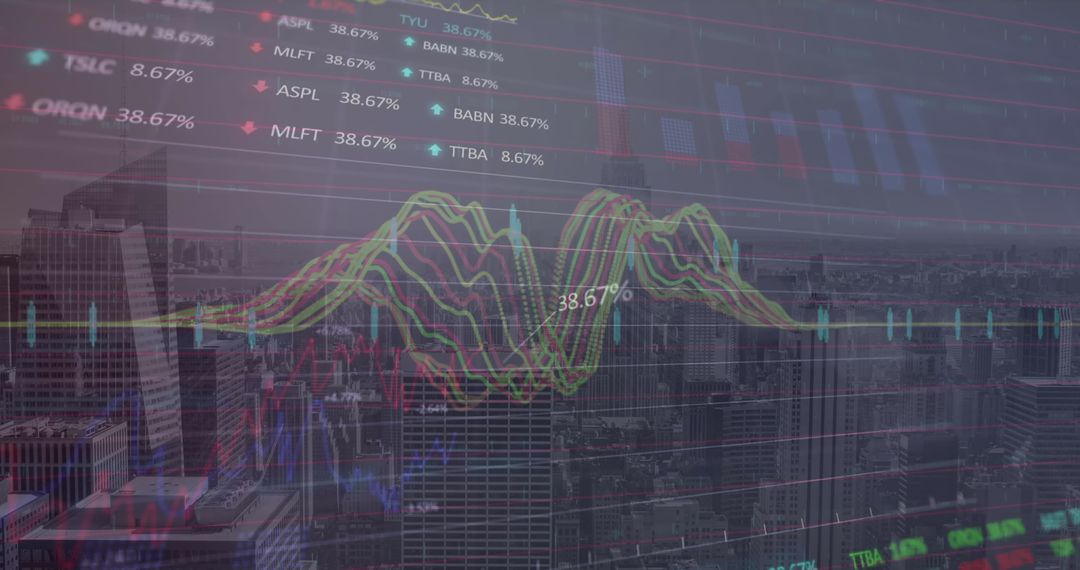
- Dynamic Financial Graphs with Futuristic Cityscape Backdrop
Dynamic Financial Graphs with Futuristic Cityscape Backdrop Image
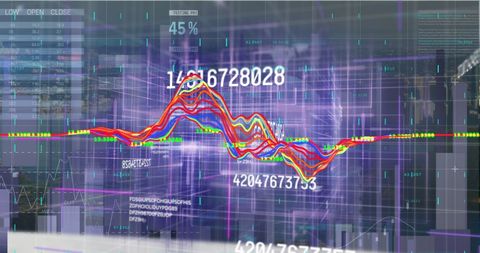
This image of financial graphs and changing numerical data superimposed over a cityscape conveys the concept of rapid changes in global finance. Suitable for illustrating economic trends, market fluctuation articles, financial technology updates, or investment strategy presentations. The dynamic visuals make this ideal for digital media that discusses futuristic finance or technology in business fields.
Powered by  - Get 15% off with code: PIKWIZARD15


2
downloads
downloads
Tags:
More
Credit Photo
If you would like to credit the Photo, here are some ways you can do so
Text Link
photo Link
<span class="text-link">
<span>
<a target="_blank" href=https://pikwizard.com/photo/dynamic-financial-graphs-with-futuristic-cityscape-backdrop/747ebf6a98c19380d3b3885d48c09f13/>PikWizard</a>
</span>
</span>
<span class="image-link">
<span
style="margin: 0 0 20px 0; display: inline-block; vertical-align: middle; width: 100%;"
>
<a
target="_blank"
href="https://pikwizard.com/photo/dynamic-financial-graphs-with-futuristic-cityscape-backdrop/747ebf6a98c19380d3b3885d48c09f13/"
style="text-decoration: none; font-size: 10px; margin: 0;"
>
<img src="https://pikwizard.com/pw/medium/747ebf6a98c19380d3b3885d48c09f13.jpg" style="margin: 0; width: 100%;" alt="" />
<p style="font-size: 12px; margin: 0;">PikWizard</p>
</a>
</span>
</span>
Free (free of charge)
Free for personal and commercial use.
Author: Authentic Images
Similar Free Stock Images

Premium


Premium


Premium


Premium


Premium


Premium


Premium


Premium


Premium


Premium


Premium


Premium


Premium


Premium


Premium


Premium


Premium


Premium


Premium


Premium


Premium


Premium


Premium


Premium