- Home >
- Stock Photos >
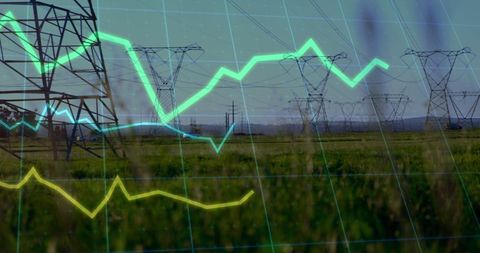
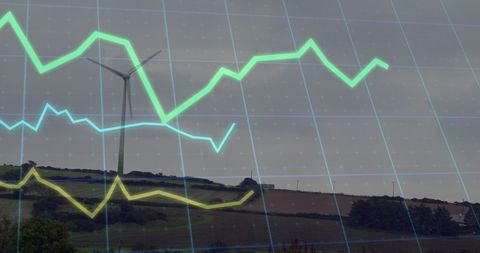
- Dynamic Financial Graphs with Global Network Overlay
Dynamic Financial Graphs with Global Network Overlay Image
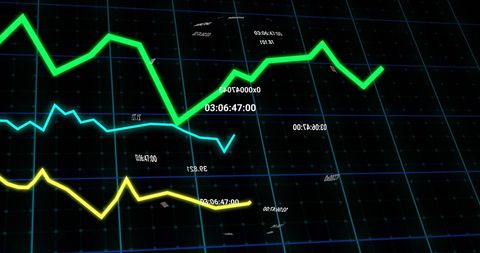
Visualizing complex data trends with green and yellow line graphs against a dark background, overlain with global network imagery. Effective for concepts around financial analysis, economic forecasting, and technology advancements. Suitable for finance presentations, technology articles, or educational resources illustrating data analysis techniques.

downloads
Tags:
More
Credit Photo
If you would like to credit the Photo, here are some ways you can do so
Text Link
photo Link
<span class="text-link">
<span>
<a target="_blank" href=https://pikwizard.com/photo/dynamic-financial-graphs-with-global-network-overlay/c6497fcdec5004a3b958c604d24eddd5/>PikWizard</a>
</span>
</span>
<span class="image-link">
<span
style="margin: 0 0 20px 0; display: inline-block; vertical-align: middle; width: 100%;"
>
<a
target="_blank"
href="https://pikwizard.com/photo/dynamic-financial-graphs-with-global-network-overlay/c6497fcdec5004a3b958c604d24eddd5/"
style="text-decoration: none; font-size: 10px; margin: 0;"
>
<img src="https://pikwizard.com/pw/medium/c6497fcdec5004a3b958c604d24eddd5.jpg" style="margin: 0; width: 100%;" alt="" />
<p style="font-size: 12px; margin: 0;">PikWizard</p>
</a>
</span>
</span>
Free (free of charge)
Free for personal and commercial use.
Author: Authentic Images