- Home >
- Stock Photos >
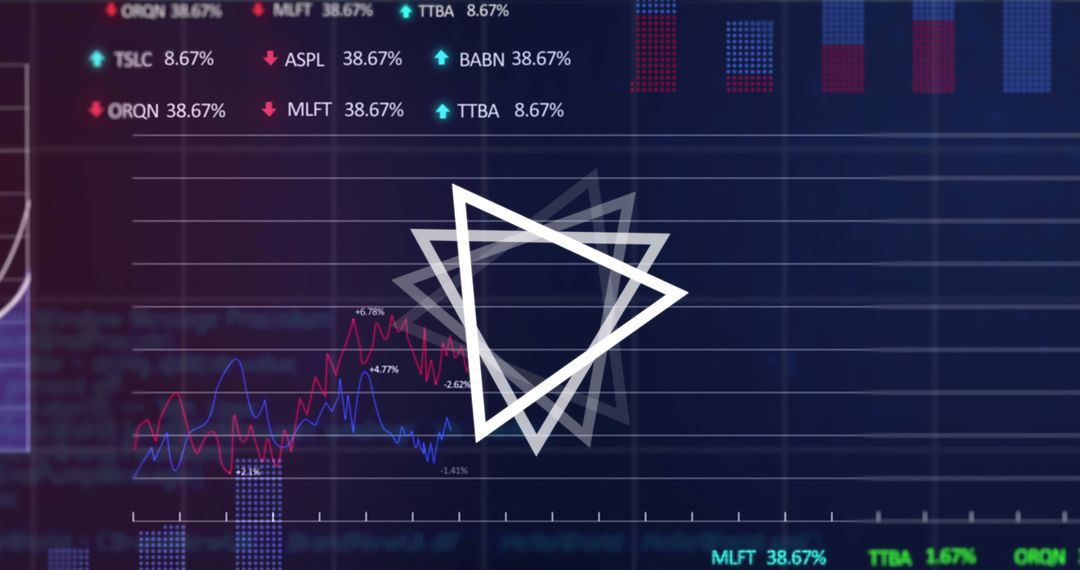
- Dynamic Financial Growth Chart on Digital Screen
Dynamic Financial Growth Chart on Digital Screen Image

A bright line graph depicts economic growth on a dark digital screen. Suitable for illustrating financial reports, economic presentations, and technology-centered discussions. Useful for websites and materials focused on finance and data analysis to emphasize trends and growth patterns.
Powered by 


2
downloads
downloads
Credit Photo
If you would like to credit the Photo, here are some ways you can do so
Text Link
photo Link
<span class="text-link">
<span>
<a target="_blank" href=https://pikwizard.com/photo/dynamic-financial-growth-chart-on-digital-screen/06ac51418e57d035dd623ad990ecee04/>PikWizard</a>
</span>
</span>
<span class="image-link">
<span
style="margin: 0 0 20px 0; display: inline-block; vertical-align: middle; width: 100%;"
>
<a
target="_blank"
href="https://pikwizard.com/photo/dynamic-financial-growth-chart-on-digital-screen/06ac51418e57d035dd623ad990ecee04/"
style="text-decoration: none; font-size: 10px; margin: 0;"
>
<img src="https://pikwizard.com/pw/medium/06ac51418e57d035dd623ad990ecee04.jpg" style="margin: 0; width: 100%;" alt="" />
<p style="font-size: 12px; margin: 0;">PikWizard</p>
</a>
</span>
</span>
Free (free of charge)
Free for personal and commercial use.
Author: Authentic Images
Similar Free Stock Images

Premium


Premium


Premium


Premium


Premium


Premium


Premium


Premium


Premium


Premium


Premium


Premium


Premium


Premium


Premium


Premium


Premium


Premium


Premium


Premium


Premium


Premium


Premium


Premium