
- Home >
- Stock Photos >
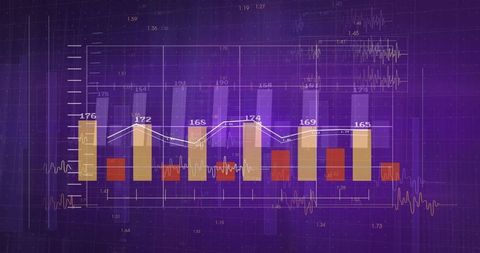
- Dynamic Financial Growth Chart Visual on Green Background
Dynamic Financial Growth Chart Visual on Green Background Image

This abstract representation of a financial growth chart includes noticeable upward trends with bar graphs against a green backdrop, suggesting themes of growth and optimism. Use this image for presentations, financial reports, investment pitches, or as engaging visual content for business articles related to funding, market analysis, or economic forecasts.
Powered by  - Get 15% off with code: PIKWIZARD15


2
downloads
downloads
Tags:
More
Credit Photo
If you would like to credit the Photo, here are some ways you can do so
Text Link
photo Link
<span class="text-link">
<span>
<a target="_blank" href=https://pikwizard.com/photo/dynamic-financial-growth-chart-visual-on-green-background/b0954c3a6dedf6c8748634fc4c6eacc6/>PikWizard</a>
</span>
</span>
<span class="image-link">
<span
style="margin: 0 0 20px 0; display: inline-block; vertical-align: middle; width: 100%;"
>
<a
target="_blank"
href="https://pikwizard.com/photo/dynamic-financial-growth-chart-visual-on-green-background/b0954c3a6dedf6c8748634fc4c6eacc6/"
style="text-decoration: none; font-size: 10px; margin: 0;"
>
<img src="https://pikwizard.com/pw/medium/b0954c3a6dedf6c8748634fc4c6eacc6.jpg" style="margin: 0; width: 100%;" alt="" />
<p style="font-size: 12px; margin: 0;">PikWizard</p>
</a>
</span>
</span>
Free (free of charge)
Free for personal and commercial use.
Author: Awesome Content
Similar Free Stock Images

Premium


Premium


Premium


Premium


Premium


Premium


Premium


Premium


Premium


Premium


Premium


Premium


Premium


Premium


Premium


Premium


Premium


Premium


Premium


Premium


Premium


Premium


Premium


Premium


Premium

