
- Home >
- Stock Photos >
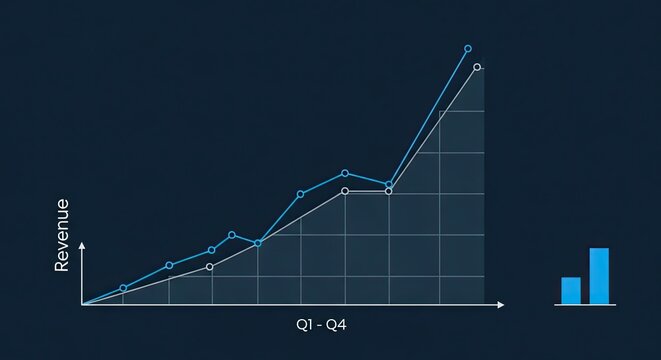
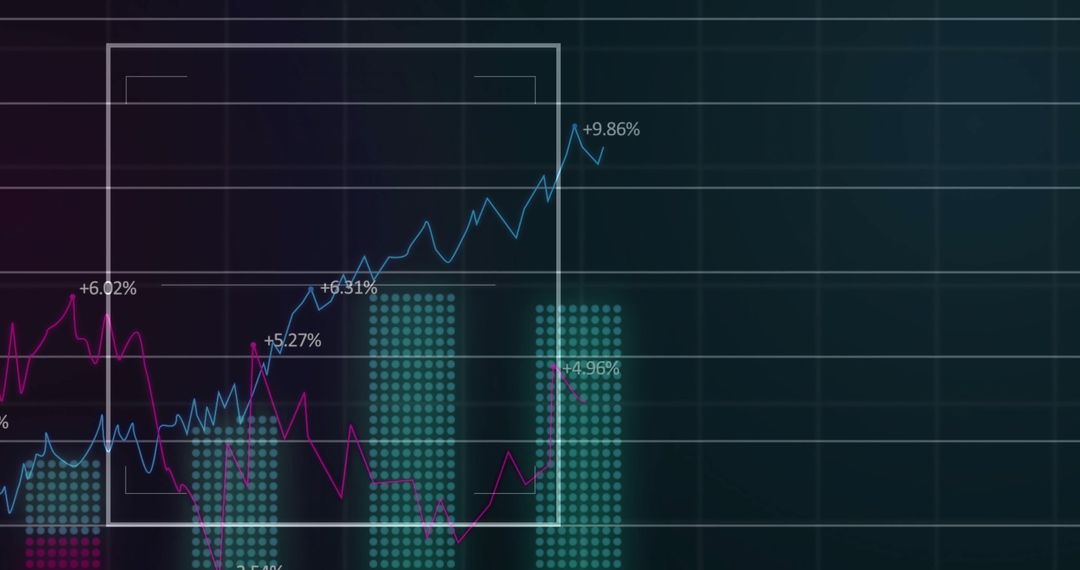
- Dynamic Financial Growth Digital Chart Display
Dynamic Financial Growth Digital Chart Display Image

This image showcases a digital rendering of a financial chart, highlighting growth trends and percentage changes. Suitable for use in business presentations, economic reports, investment analysis, and financial websites. The dynamic visual emphasizes global connections and data processing advancements, making it ideal for illustrating market insights and strategic planning.
Powered by 


2
downloads
downloads
Tags:
More
Credit Photo
If you would like to credit the Photo, here are some ways you can do so
Text Link
photo Link
<span class="text-link">
<span>
<a target="_blank" href=https://pikwizard.com/photo/dynamic-financial-growth-digital-chart-display/055209a7febc858eac095d438628e176/>PikWizard</a>
</span>
</span>
<span class="image-link">
<span
style="margin: 0 0 20px 0; display: inline-block; vertical-align: middle; width: 100%;"
>
<a
target="_blank"
href="https://pikwizard.com/photo/dynamic-financial-growth-digital-chart-display/055209a7febc858eac095d438628e176/"
style="text-decoration: none; font-size: 10px; margin: 0;"
>
<img src="https://pikwizard.com/pw/medium/055209a7febc858eac095d438628e176.jpg" style="margin: 0; width: 100%;" alt="" />
<p style="font-size: 12px; margin: 0;">PikWizard</p>
</a>
</span>
</span>
Free (free of charge)
Free for personal and commercial use.
Author: People Creations
Similar Free Stock Images

Premium


Premium


Premium


Premium


Premium


Premium


Premium


Premium


Premium


Premium


Premium


Premium


Premium


Premium


Premium


Premium


Premium


Premium


Premium


Premium


Premium


Premium


Premium


Premium

