
- Home >
- Stock Photos >
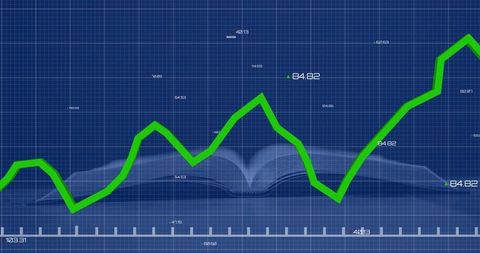
- Dynamic Financial Growth Graph on Blue Grid Background
Dynamic Financial Growth Graph on Blue Grid Background Image

Represents growing data with graph illustration against blue grid backdrop, suggesting statistical data analysis, economy trends, and business reports use. Ideal for financial presentations, economic trend discussions, and graphic business planning, emphasising digital technology impact within finance sector.
Powered by  - Get 15% off with code: PIKWIZARD15


2
downloads
downloads
Tags:
More
Credit Photo
If you would like to credit the Photo, here are some ways you can do so
Text Link
photo Link
<span class="text-link">
<span>
<a target="_blank" href=https://pikwizard.com/photo/dynamic-financial-growth-graph-on-blue-grid-background/411349aae03aff79c2a1f67f487f9483/>PikWizard</a>
</span>
</span>
<span class="image-link">
<span
style="margin: 0 0 20px 0; display: inline-block; vertical-align: middle; width: 100%;"
>
<a
target="_blank"
href="https://pikwizard.com/photo/dynamic-financial-growth-graph-on-blue-grid-background/411349aae03aff79c2a1f67f487f9483/"
style="text-decoration: none; font-size: 10px; margin: 0;"
>
<img src="https://pikwizard.com/pw/medium/411349aae03aff79c2a1f67f487f9483.jpg" style="margin: 0; width: 100%;" alt="" />
<p style="font-size: 12px; margin: 0;">PikWizard</p>
</a>
</span>
</span>
Free (free of charge)
Free for personal and commercial use.
Author: People Creations
Similar Free Stock Images

Premium


Premium


Premium


Premium


Premium


Premium


Premium


Premium


Premium


Premium


Premium


Premium


Premium


Premium


Premium


Premium


Premium


Premium


Premium


Premium


Premium


Premium


Premium


Premium


Premium

