- Home >
- Stock Photos >
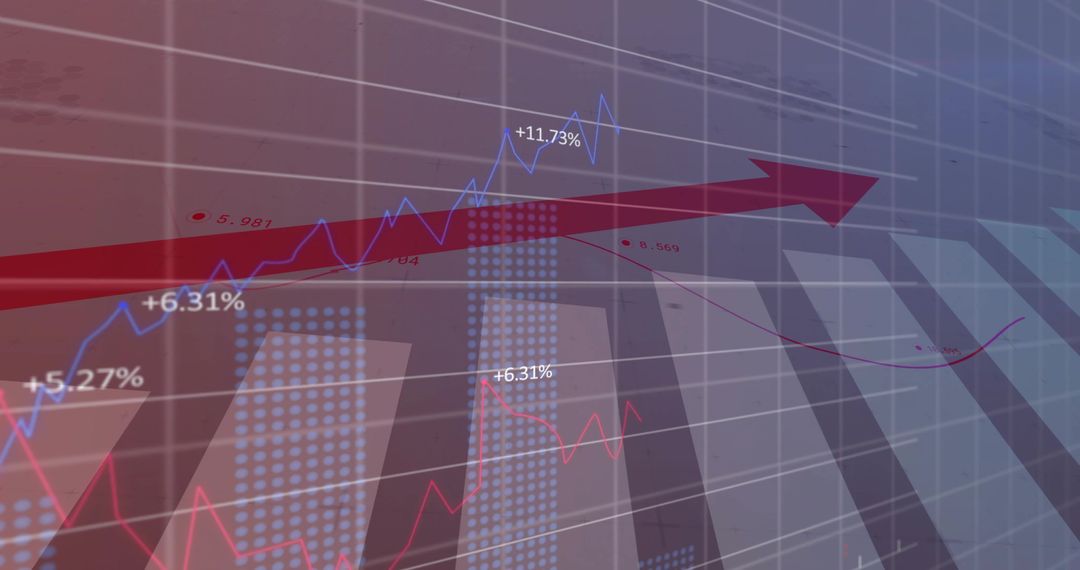
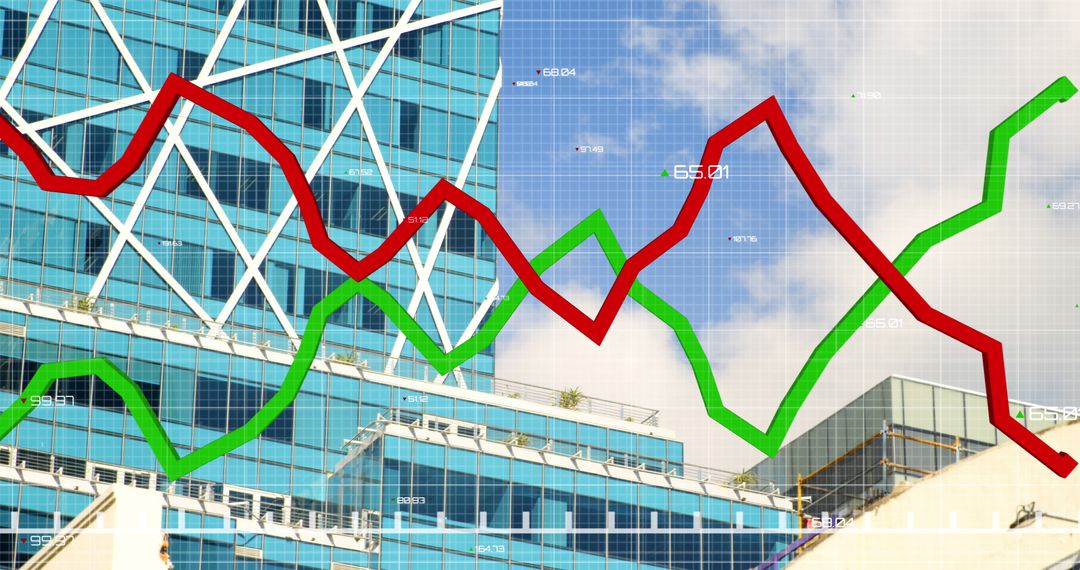
- Dynamic Financial Growth Trends with Analytics Visualization
Dynamic Financial Growth Trends with Analytics Visualization Image

Visual representing financial data trends combines line and bar charts with up and down arrows to indicate market fluctuations. Useful for illustrating concepts of market analytics, corporate forecasting, and investment strategies. Effective as visual aid in presentations, reports, and educational material on finance and economics.
Powered by 


0
downloads
downloads
Tags:
More
Credit Photo
If you would like to credit the Photo, here are some ways you can do so
Text Link
photo Link
<span class="text-link">
<span>
<a target="_blank" href=https://pikwizard.com/photo/dynamic-financial-growth-trends-with-analytics-visualization/f9c12474336683438aadb38a97c2355f/>PikWizard</a>
</span>
</span>
<span class="image-link">
<span
style="margin: 0 0 20px 0; display: inline-block; vertical-align: middle; width: 100%;"
>
<a
target="_blank"
href="https://pikwizard.com/photo/dynamic-financial-growth-trends-with-analytics-visualization/f9c12474336683438aadb38a97c2355f/"
style="text-decoration: none; font-size: 10px; margin: 0;"
>
<img src="https://pikwizard.com/pw/medium/f9c12474336683438aadb38a97c2355f.jpg" style="margin: 0; width: 100%;" alt="" />
<p style="font-size: 12px; margin: 0;">PikWizard</p>
</a>
</span>
</span>
Free (free of charge)
Free for personal and commercial use.
Author: People Creations
Similar Free Stock Images

Premium


Premium


Premium


Premium


Premium


Premium


Premium


Premium


Premium


Premium


Premium


Premium


Premium


Premium


Premium


Premium


Premium


Premium


Premium


Premium


Premium


Premium


Premium


Premium