- Home >
- Stock Photos >
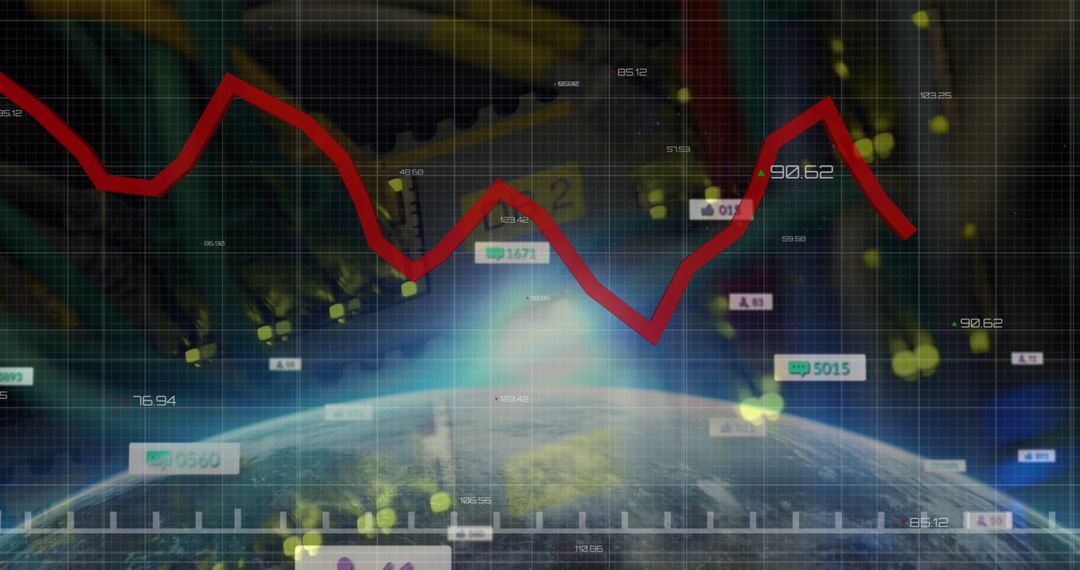
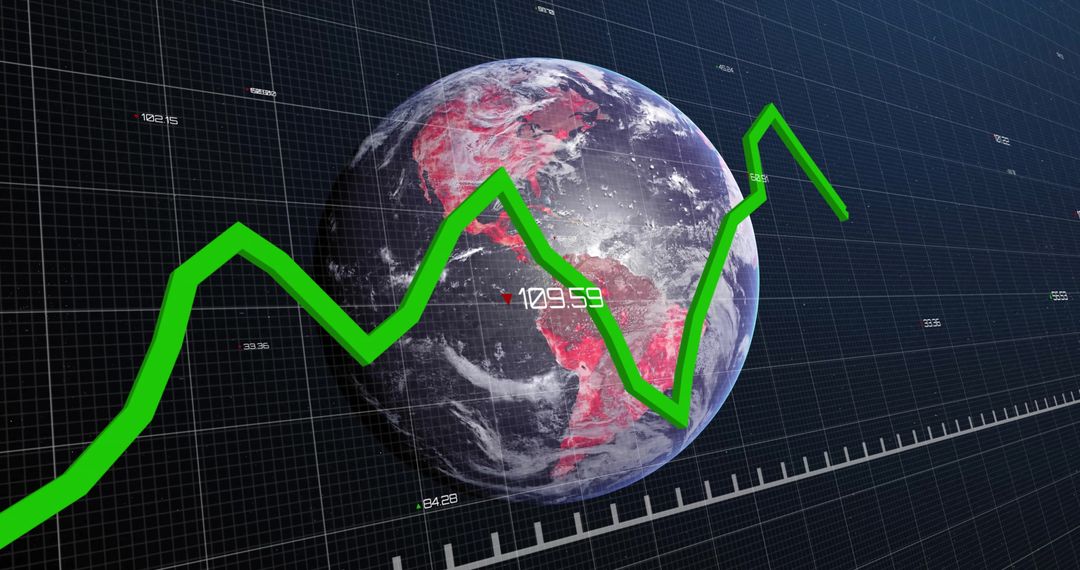
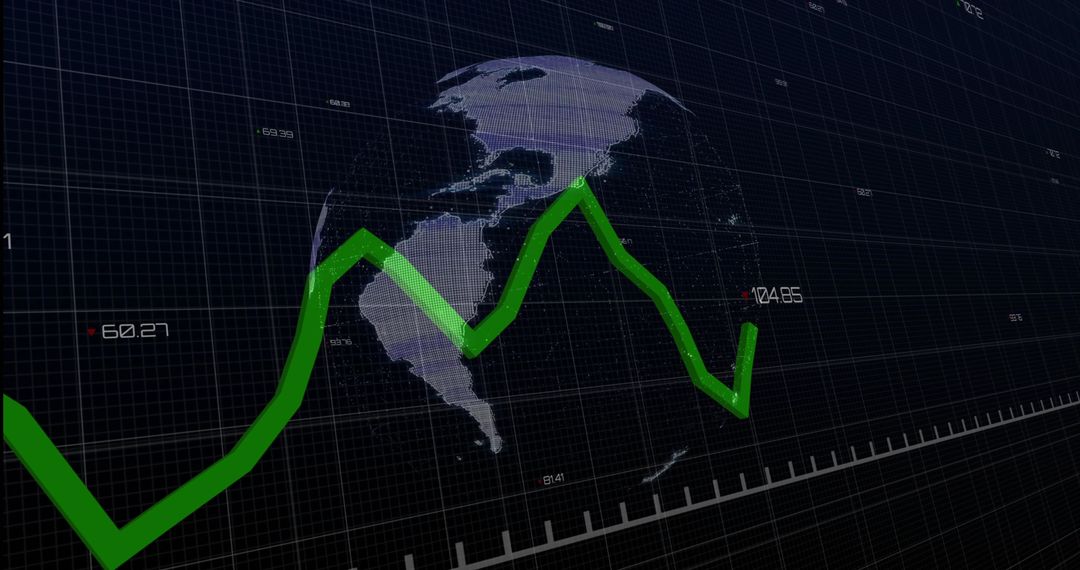
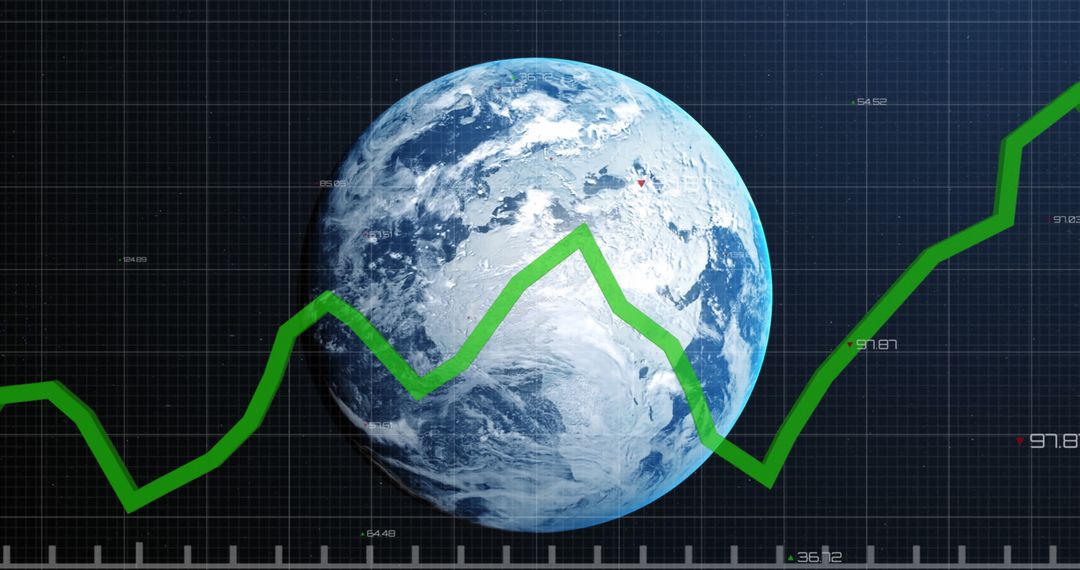
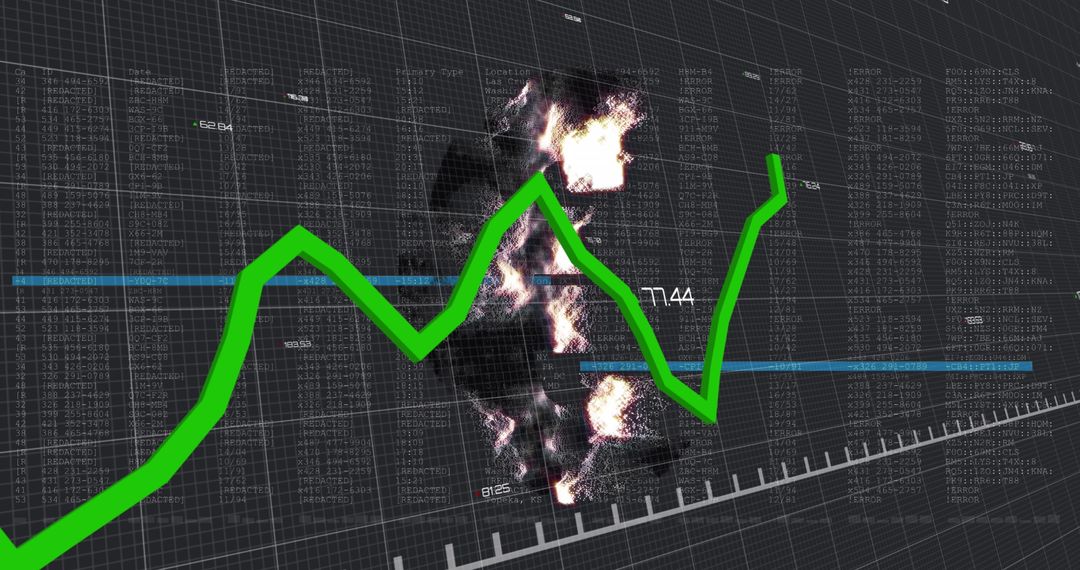
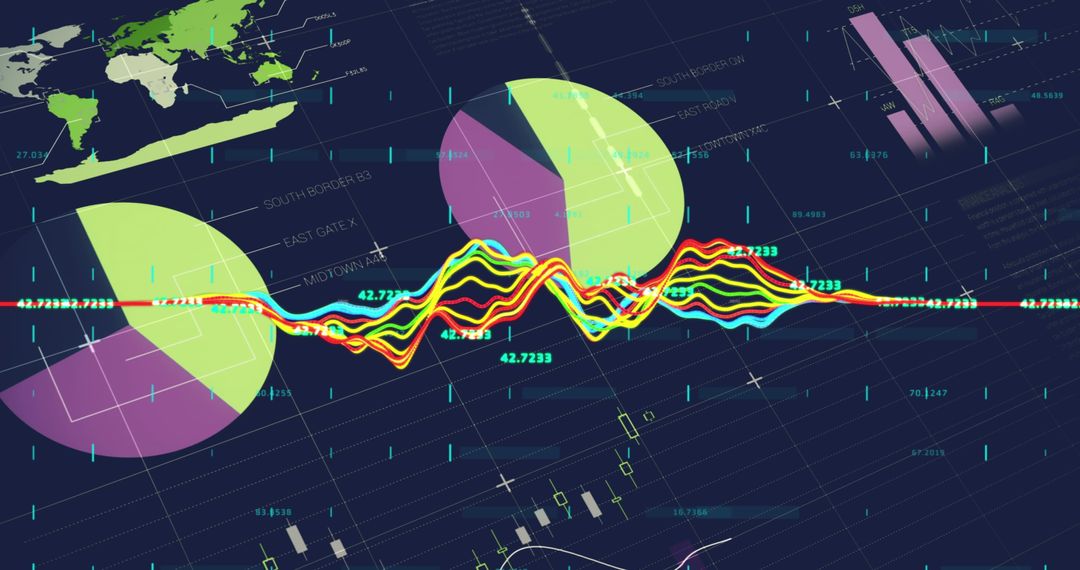
- Dynamic Financial Infographic with Moving Green Graph Line
Dynamic Financial Infographic with Moving Green Graph Line Image

Dynamic display shows a digital combination of a green line graph and a multicolored pie chart against a dark grid background, enriched with illuminated accents. Ideal for use in marketing materials related to business analytics, financial technology, or economic forecasting. Useful in presentations or reports focused on market trends and data analyses.
Powered by 


2
downloads
downloads
Tags:
More
Credit Photo
If you would like to credit the Photo, here are some ways you can do so
Text Link
photo Link
<span class="text-link">
<span>
<a target="_blank" href=https://pikwizard.com/photo/dynamic-financial-infographic-with-moving-green-graph-line/1e5e191f93c0c9e5010bad2afe075601/>PikWizard</a>
</span>
</span>
<span class="image-link">
<span
style="margin: 0 0 20px 0; display: inline-block; vertical-align: middle; width: 100%;"
>
<a
target="_blank"
href="https://pikwizard.com/photo/dynamic-financial-infographic-with-moving-green-graph-line/1e5e191f93c0c9e5010bad2afe075601/"
style="text-decoration: none; font-size: 10px; margin: 0;"
>
<img src="https://pikwizard.com/pw/medium/1e5e191f93c0c9e5010bad2afe075601.jpg" style="margin: 0; width: 100%;" alt="" />
<p style="font-size: 12px; margin: 0;">PikWizard</p>
</a>
</span>
</span>
Free (free of charge)
Free for personal and commercial use.
Author: People Creations
Similar Free Stock Images

Premium


Premium


Premium


Premium


Premium


Premium


Premium


Premium


Premium


Premium


Premium


Premium


Premium


Premium


Premium


Premium


Premium


Premium


Premium


Premium


Premium


Premium


Premium


Premium