- Home >
- Stock Photos >
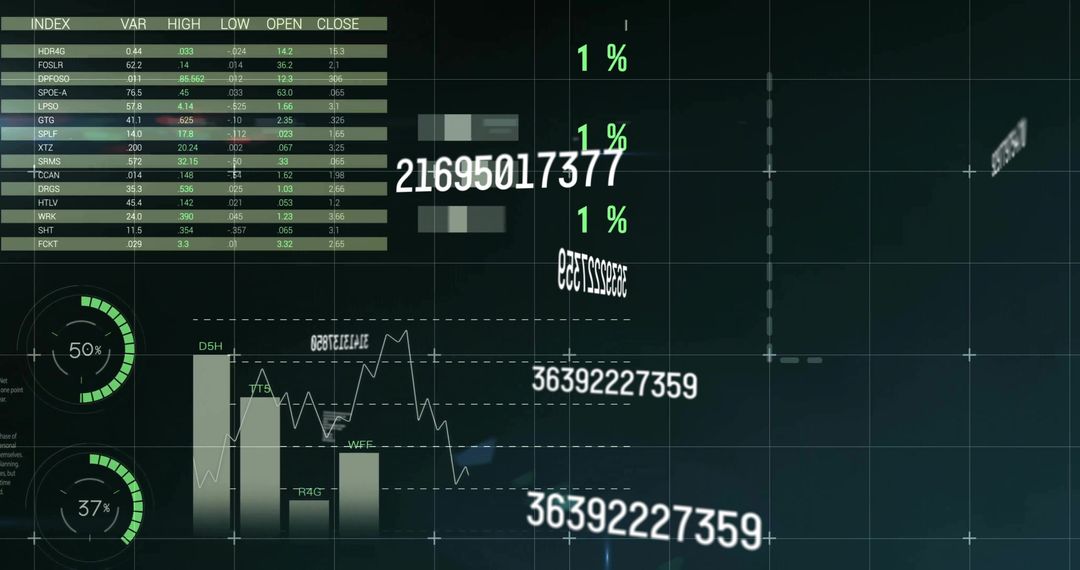
- Dynamic Financial Market Analysis with Graphs and Numbers Overlay
Dynamic Financial Market Analysis with Graphs and Numbers Overlay Image

Image features dynamic overlay of financial data with graph lines and numbers, suggesting real-time stock market analysis. Ideal for website banners, investment blogs, financial news outlets, or fintech app design material. Highlights global connectivity and sophisticated data analysis of financial markets.
Powered by  - Get 15% off with code: PIKWIZARD15


2
downloads
downloads
Tags:
More
Credit Photo
If you would like to credit the Photo, here are some ways you can do so
Text Link
photo Link
<span class="text-link">
<span>
<a target="_blank" href=https://pikwizard.com/photo/dynamic-financial-market-analysis-with-graphs-and-numbers-overlay/59cec9e4effd630d102f56523540d003/>PikWizard</a>
</span>
</span>
<span class="image-link">
<span
style="margin: 0 0 20px 0; display: inline-block; vertical-align: middle; width: 100%;"
>
<a
target="_blank"
href="https://pikwizard.com/photo/dynamic-financial-market-analysis-with-graphs-and-numbers-overlay/59cec9e4effd630d102f56523540d003/"
style="text-decoration: none; font-size: 10px; margin: 0;"
>
<img src="https://pikwizard.com/pw/medium/59cec9e4effd630d102f56523540d003.jpg" style="margin: 0; width: 100%;" alt="" />
<p style="font-size: 12px; margin: 0;">PikWizard</p>
</a>
</span>
</span>
Free (free of charge)
Free for personal and commercial use.
Author: Authentic Images
Similar Free Stock Images

Premium


Premium


Premium


Premium


Premium


Premium


Premium


Premium


Premium


Premium


Premium


Premium


Premium


Premium


Premium


Premium


Premium


Premium


Premium


Premium


Premium


Premium


Premium


Premium