
- Home >
- Stock Photos >
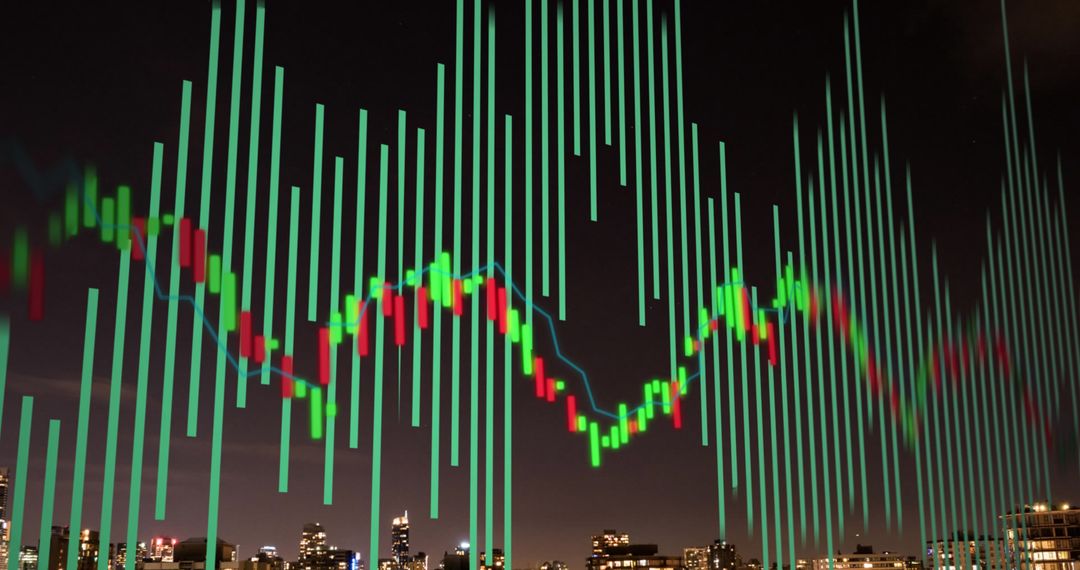
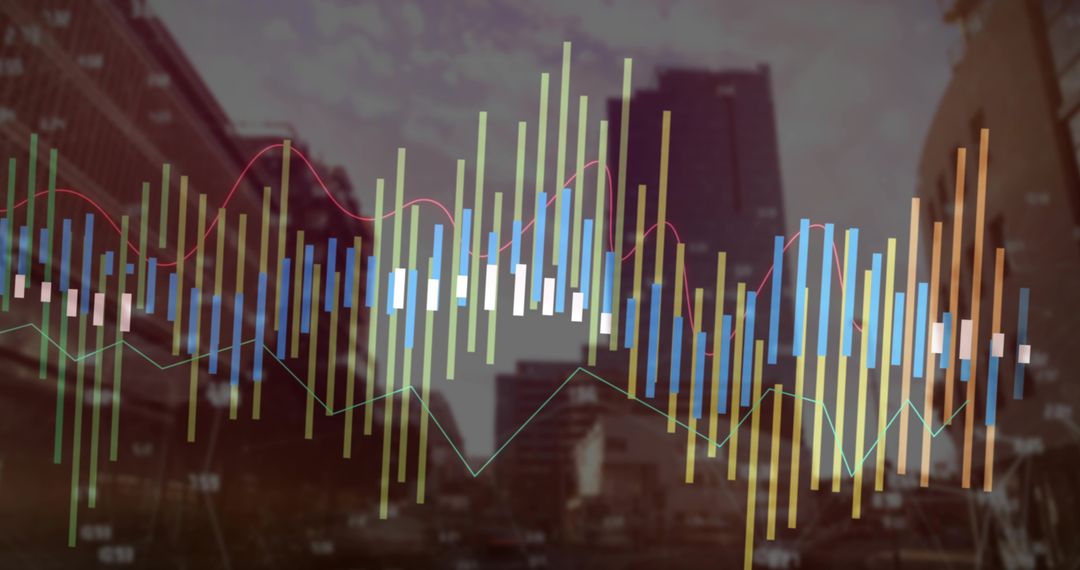
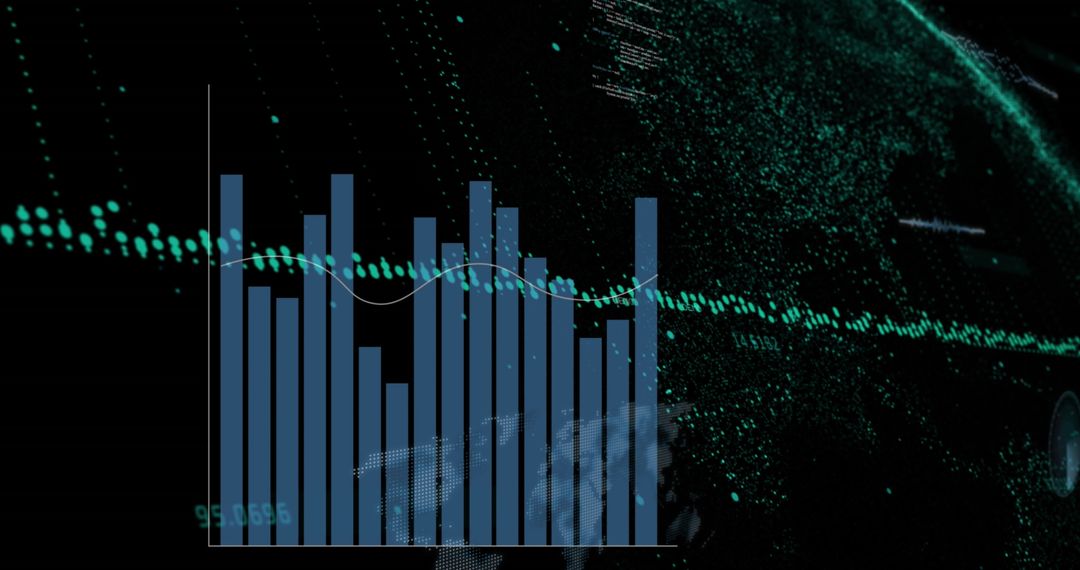
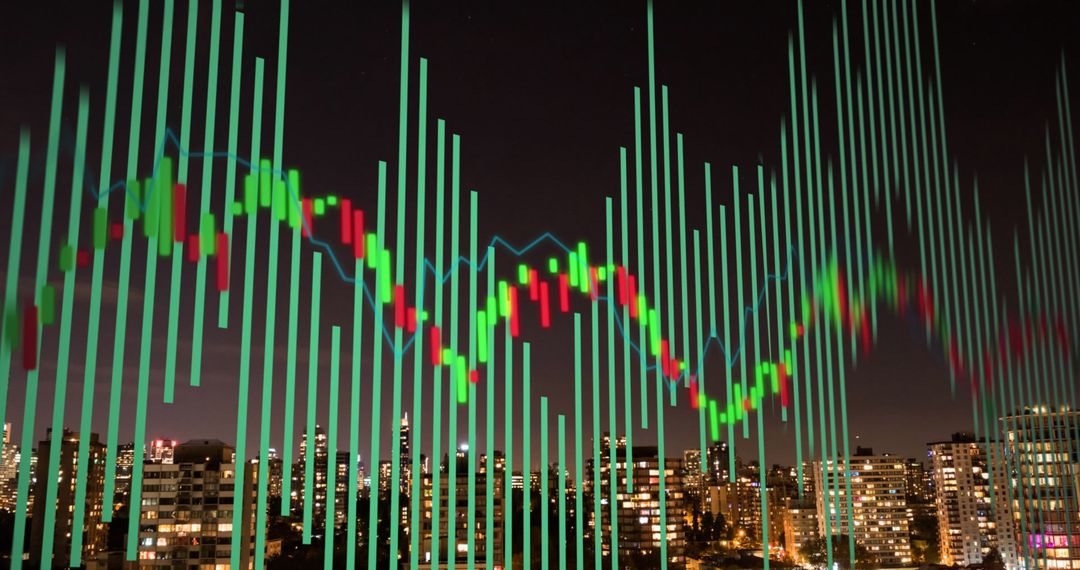
- Dynamic Financial Market Chart Display with Candlesticks
Dynamic Financial Market Chart Display with Candlesticks Image

Vibrant display of a financial market chart highlights such elements as bars, candlesticks, and dynamic lines for analyzing trends and movements. Ideal for representing financial data analysis, trading investments, and technology insights. Can be used for educational purposes and business presentations relating to the stock market and economic strategies.
Powered by  - Get 15% off with code: PIKWIZARD15


0
downloads
downloads
Tags:
More
Credit Photo
If you would like to credit the Photo, here are some ways you can do so
Text Link
photo Link
<span class="text-link">
<span>
<a target="_blank" href=https://pikwizard.com/photo/dynamic-financial-market-chart-display-with-candlesticks/3c3a5ecf1a9fec9d9af3be256f7520ad/>PikWizard</a>
</span>
</span>
<span class="image-link">
<span
style="margin: 0 0 20px 0; display: inline-block; vertical-align: middle; width: 100%;"
>
<a
target="_blank"
href="https://pikwizard.com/photo/dynamic-financial-market-chart-display-with-candlesticks/3c3a5ecf1a9fec9d9af3be256f7520ad/"
style="text-decoration: none; font-size: 10px; margin: 0;"
>
<img src="https://pikwizard.com/pw/medium/3c3a5ecf1a9fec9d9af3be256f7520ad.jpg" style="margin: 0; width: 100%;" alt="" />
<p style="font-size: 12px; margin: 0;">PikWizard</p>
</a>
</span>
</span>
Free (free of charge)
Free for personal and commercial use.
Author: Authentic Images
Similar Free Stock Images

Premium


Premium


Premium


Premium


Premium


Premium


Premium


Premium


Premium


Premium


Premium


Premium


Premium


Premium


Premium


Premium


Premium


Premium


Premium


Premium


Premium


Premium


Premium


Premium

