
- Home >
- Stock Photos >
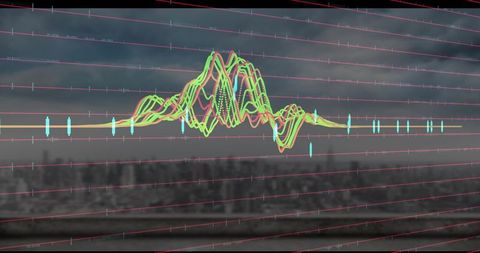
- Dynamic Financial Market Chart on Digital Grid
Dynamic Financial Market Chart on Digital Grid Image

Vibrant graph displaying fluctuating financial data on a digital grid symbolizes market volatility and economic trends. Ideal for illustrating financial articles, investment reports, economic studies, business presentations, and digital dashboards showcasing economic analysis.
Powered by  - Get 15% off with code: PIKWIZARD15


downloads
Tags:
More
Credit Photo
If you would like to credit the Photo, here are some ways you can do so
Text Link
photo Link
<span class="text-link">
<span>
<a target="_blank" href=https://pikwizard.com/photo/dynamic-financial-market-chart-on-digital-grid/a3980fb541e3915d1d3e0644988fd3b3/>PikWizard</a>
</span>
</span>
<span class="image-link">
<span
style="margin: 0 0 20px 0; display: inline-block; vertical-align: middle; width: 100%;"
>
<a
target="_blank"
href="https://pikwizard.com/photo/dynamic-financial-market-chart-on-digital-grid/a3980fb541e3915d1d3e0644988fd3b3/"
style="text-decoration: none; font-size: 10px; margin: 0;"
>
<img src="https://pikwizard.com/pw/medium/a3980fb541e3915d1d3e0644988fd3b3.jpg" style="margin: 0; width: 100%;" alt="" />
<p style="font-size: 12px; margin: 0;">PikWizard</p>
</a>
</span>
</span>
Free (free of charge)
Free for personal and commercial use.
Author: Awesome Content
Similar Free Stock Images

Premium


Premium

Premium


Premium


Premium


Premium


Premium

Premium

Premium


Premium


Premium


Premium

Premium

Premium


Premium


Premium

Premium


Premium


Premium

Premium


Premium

Premium


Premium


Premium


Premium


Explore More Free Stock Images