- Home >
- Stock Photos >
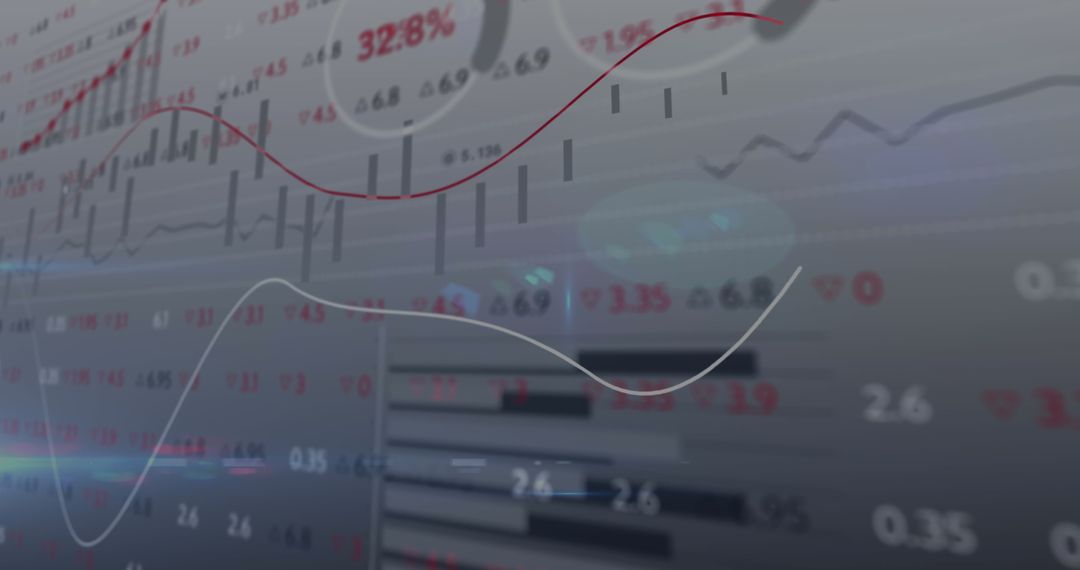
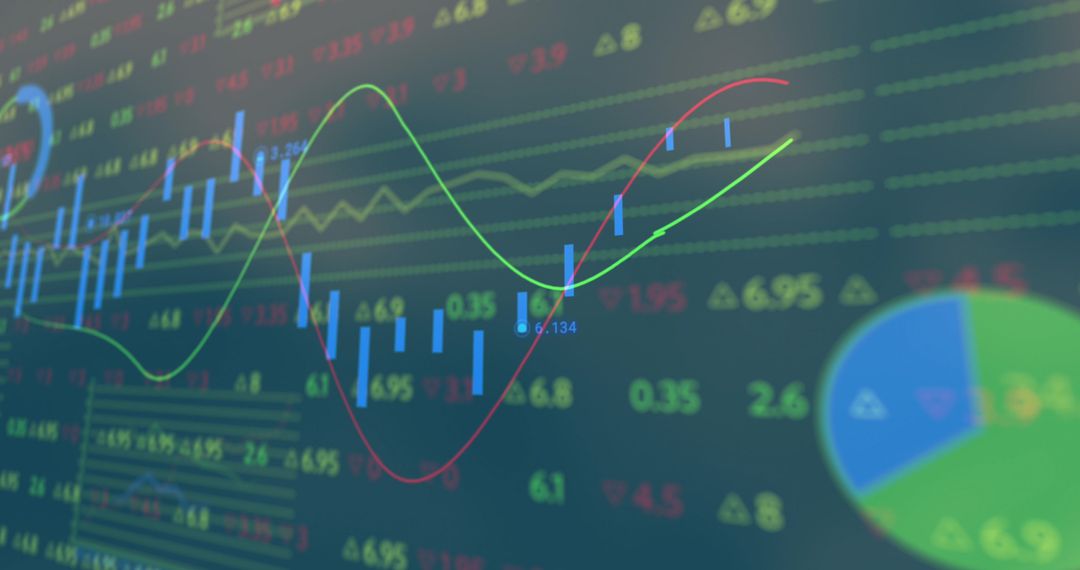
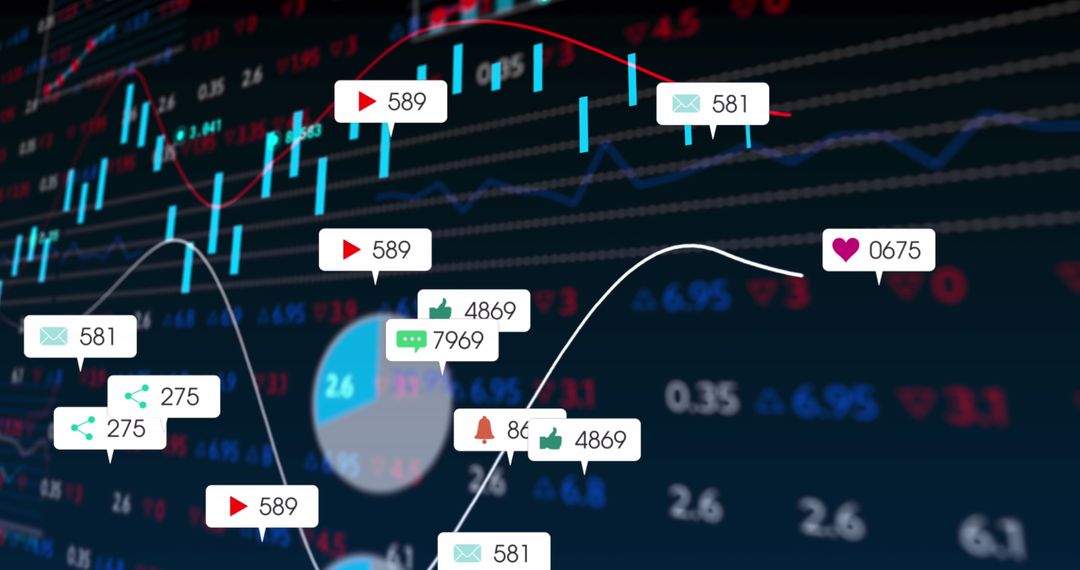
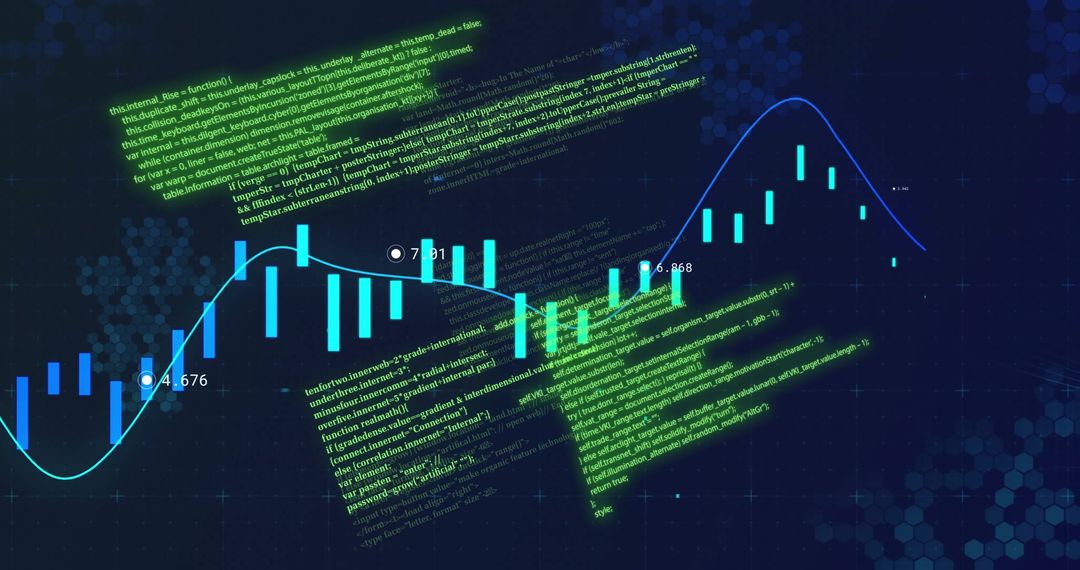
- Dynamic Financial Market Data and Business Technology Concept
Dynamic Financial Market Data and Business Technology Concept Image

Visual representing constantly fluctuating financial data and economic statistics, suitable for illustrating concepts in finance, investment strategies, and business technology advancements. Useful for articles, presentations, and websites focusing on trading, stock markets, and the technological impact on economic sectors.
Powered by 


2
downloads
downloads
Tags:
More
Credit Photo
If you would like to credit the Photo, here are some ways you can do so
Text Link
photo Link
<span class="text-link">
<span>
<a target="_blank" href=https://pikwizard.com/photo/dynamic-financial-market-data-and-business-technology-concept/0c8255e28fc48bf01b4d8e5cd2da198f/>PikWizard</a>
</span>
</span>
<span class="image-link">
<span
style="margin: 0 0 20px 0; display: inline-block; vertical-align: middle; width: 100%;"
>
<a
target="_blank"
href="https://pikwizard.com/photo/dynamic-financial-market-data-and-business-technology-concept/0c8255e28fc48bf01b4d8e5cd2da198f/"
style="text-decoration: none; font-size: 10px; margin: 0;"
>
<img src="https://pikwizard.com/pw/medium/0c8255e28fc48bf01b4d8e5cd2da198f.jpg" style="margin: 0; width: 100%;" alt="" />
<p style="font-size: 12px; margin: 0;">PikWizard</p>
</a>
</span>
</span>
Free (free of charge)
Free for personal and commercial use.
Author: Creative Art
Similar Free Stock Images

Premium


Premium


Premium


Premium


Premium


Premium


Premium


Premium


Premium


Premium


Premium


Premium


Premium


Premium


Premium


Premium


Premium


Premium


Premium


Premium


Premium


Premium


Premium


Premium