
- Home >
- Stock Photos >
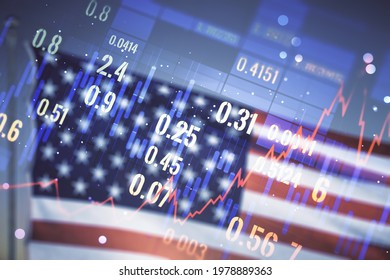
- Dynamic Financial Market Graph Amidst Digital Equations
Dynamic Financial Market Graph Amidst Digital Equations Image

Intense blend of financial graphs with digital mathematical equations swirling in the background, symbolizing the intersection of finance and technology. Ideal for illustrating concepts related to stock analysis, data-driven decision making, or the digitization of financial services. Use in financial reports, educational materials on trading analytics, or presentations on economic strategies and investment tips.
Powered by  - Get 15% off with code: PIKWIZARD15


downloads
Tags:
More
Credit Photo
If you would like to credit the Photo, here are some ways you can do so
Text Link
photo Link
<span class="text-link">
<span>
<a target="_blank" href=https://pikwizard.com/photo/dynamic-financial-market-graph-amidst-digital-equations/490f79dd94adc996372282bd1abad38f/>PikWizard</a>
</span>
</span>
<span class="image-link">
<span
style="margin: 0 0 20px 0; display: inline-block; vertical-align: middle; width: 100%;"
>
<a
target="_blank"
href="https://pikwizard.com/photo/dynamic-financial-market-graph-amidst-digital-equations/490f79dd94adc996372282bd1abad38f/"
style="text-decoration: none; font-size: 10px; margin: 0;"
>
<img src="https://pikwizard.com/pw/medium/490f79dd94adc996372282bd1abad38f.jpg" style="margin: 0; width: 100%;" alt="" />
<p style="font-size: 12px; margin: 0;">PikWizard</p>
</a>
</span>
</span>
Free (free of charge)
Free for personal and commercial use.
Author: Awesome Content
Similar Free Stock Images
Loading...

Premium


Premium

Premium
Premium

Premium


Premium

Premium

Premium


Premium


Premium


Premium


Premium

Premium


Premium

Premium

Premium


Premium

Premium

Premium

Premium


Premium


Premium


Premium


Premium

Premium


Explore More Free Stock Images