- Home >
- Stock Photos >
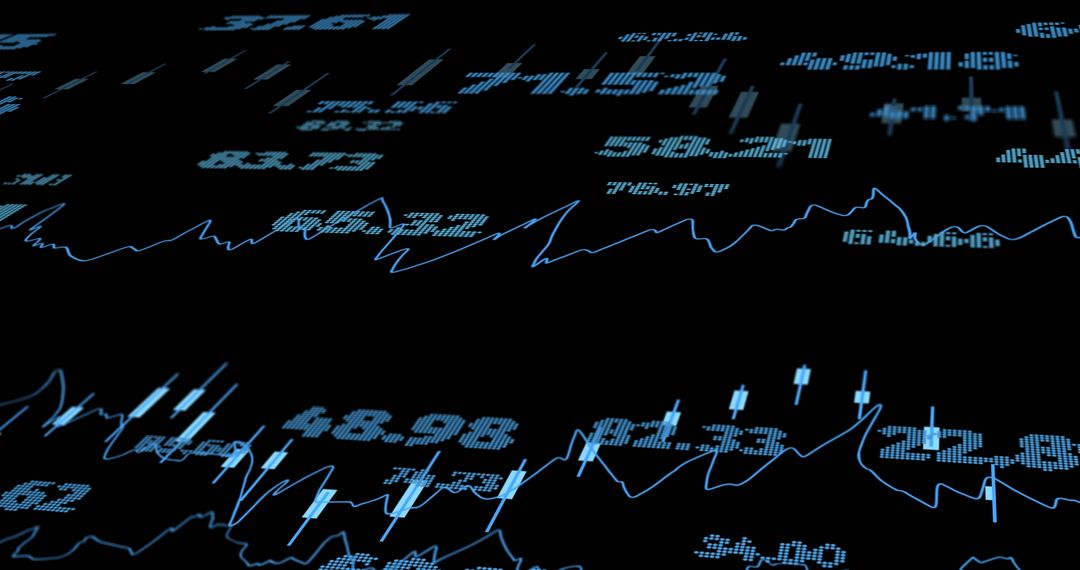
- Dynamic Financial Metrics with Real-Time Graphs and Data
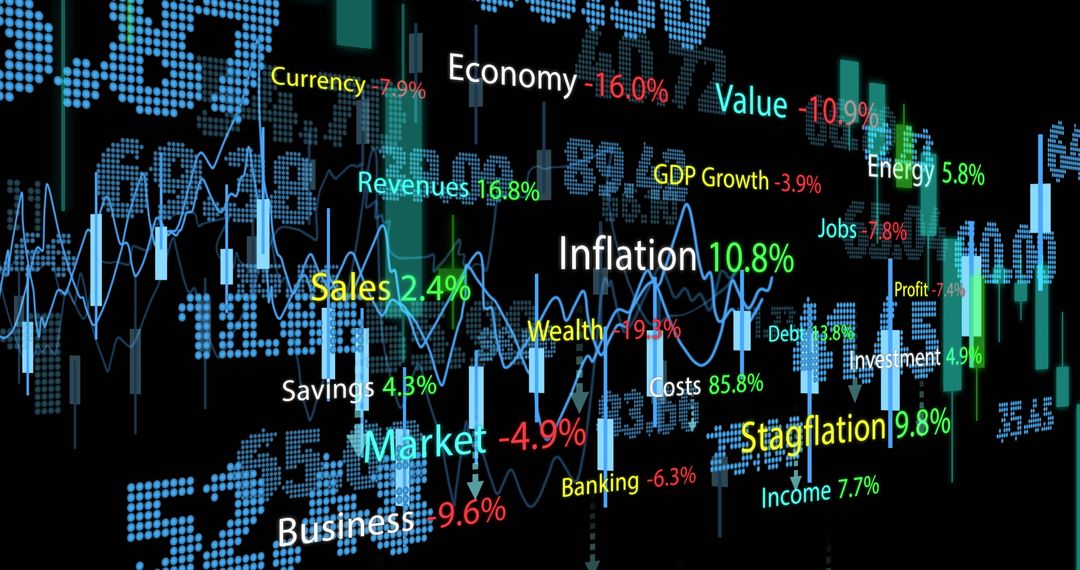
Dynamic Financial Metrics with Real-Time Graphs and Data Image

This illustration showcases fluctuating financial data with emphasis on sectors like economy, banking, and income. Ideal for articles and presentations focusing on market trends, economic reports, and investment strategies. Useful for financial advisors, data analysts, and economists illustrating real-time market dynamics.
Powered by  - Get 15% off with code: PIKWIZARD15


2
downloads
downloads
Tags:
More
Credit Photo
If you would like to credit the Photo, here are some ways you can do so
Text Link
photo Link
<span class="text-link">
<span>
<a target="_blank" href=https://pikwizard.com/photo/dynamic-financial-metrics-with-real-time-graphs-and-data/cbc9559f6de36f01a5d0afc28218e79b/>PikWizard</a>
</span>
</span>
<span class="image-link">
<span
style="margin: 0 0 20px 0; display: inline-block; vertical-align: middle; width: 100%;"
>
<a
target="_blank"
href="https://pikwizard.com/photo/dynamic-financial-metrics-with-real-time-graphs-and-data/cbc9559f6de36f01a5d0afc28218e79b/"
style="text-decoration: none; font-size: 10px; margin: 0;"
>
<img src="https://pikwizard.com/pw/medium/cbc9559f6de36f01a5d0afc28218e79b.jpg" style="margin: 0; width: 100%;" alt="" />
<p style="font-size: 12px; margin: 0;">PikWizard</p>
</a>
</span>
</span>
Free (free of charge)
Free for personal and commercial use.
Author: Creative Art
Similar Free Stock Images

Premium


Premium


Premium


Premium


Premium


Premium


Premium


Premium


Premium


Premium


Premium


Premium


Premium


Premium


Premium


Premium


Premium


Premium


Premium


Premium


Premium


Premium


Premium


Premium