- Home >
- Stock Photos >
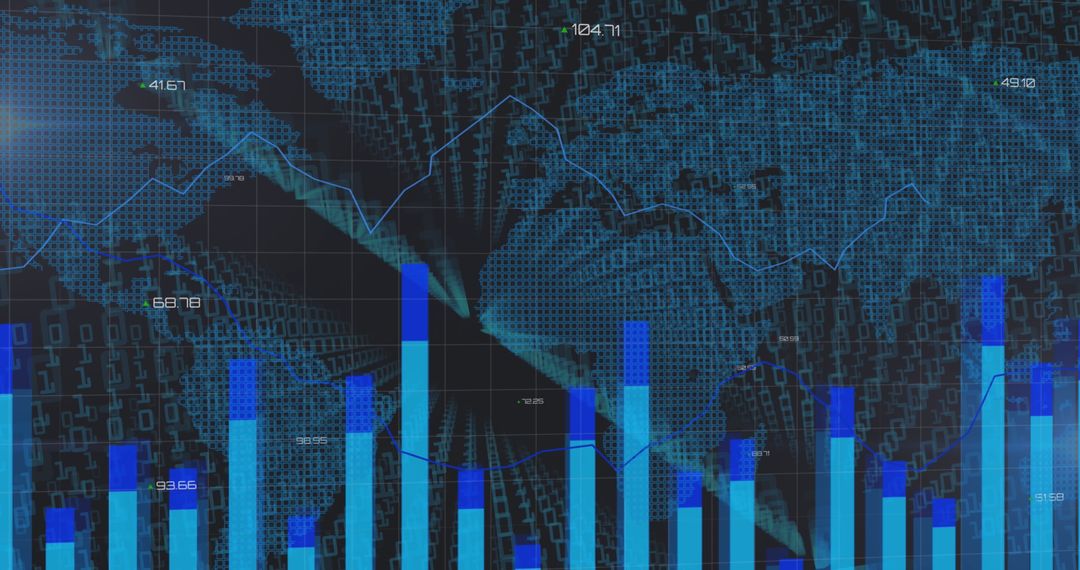
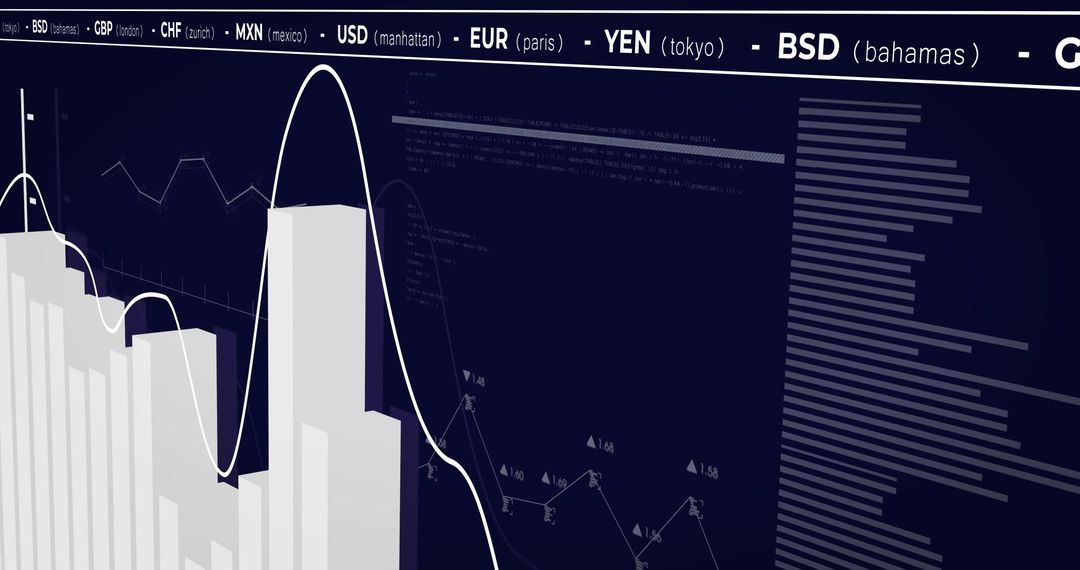
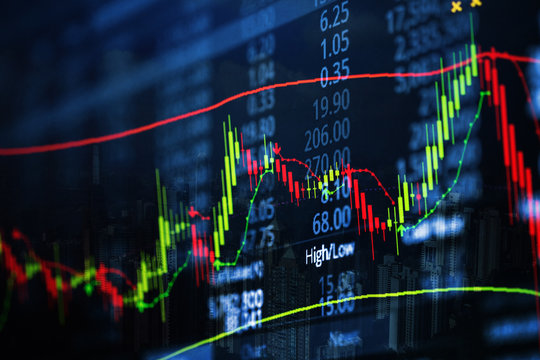
- Dynamic Financial Stock Market Dashboard with Charts and Graphs
Dynamic Financial Stock Market Dashboard with Charts and Graphs Image

This vibrant digital interface portrays a composite of fluctuating financial data and market indicators, including candlestick charts and dozens of colorful line graphs. The complex visuals enhance the theme of analytics and trading technology for educators, market analysts, and digital financial services creators. Perfect for use in finance-themed presentations, blog content about investment strategies, digital dashboards, and financial analytics reports.
Powered by 


2
downloads
downloads
Tags:
More
Credit Photo
If you would like to credit the Photo, here are some ways you can do so
Text Link
photo Link
<span class="text-link">
<span>
<a target="_blank" href=https://pikwizard.com/photo/dynamic-financial-stock-market-dashboard-with-charts-and-graphs/22a1ef27071f3df45c43c837fb1a6b3e/>PikWizard</a>
</span>
</span>
<span class="image-link">
<span
style="margin: 0 0 20px 0; display: inline-block; vertical-align: middle; width: 100%;"
>
<a
target="_blank"
href="https://pikwizard.com/photo/dynamic-financial-stock-market-dashboard-with-charts-and-graphs/22a1ef27071f3df45c43c837fb1a6b3e/"
style="text-decoration: none; font-size: 10px; margin: 0;"
>
<img src="https://pikwizard.com/pw/medium/22a1ef27071f3df45c43c837fb1a6b3e.jpg" style="margin: 0; width: 100%;" alt="" />
<p style="font-size: 12px; margin: 0;">PikWizard</p>
</a>
</span>
</span>
Free (free of charge)
Free for personal and commercial use.
Author: Awesome Content
Similar Free Stock Images

Premium


Premium


Premium


Premium


Premium


Premium


Premium


Premium


Premium


Premium


Premium


Premium


Premium


Premium


Premium


Premium


Premium


Premium


Premium


Premium


Premium


Premium


Premium


Premium