- Home >
- Stock Photos >
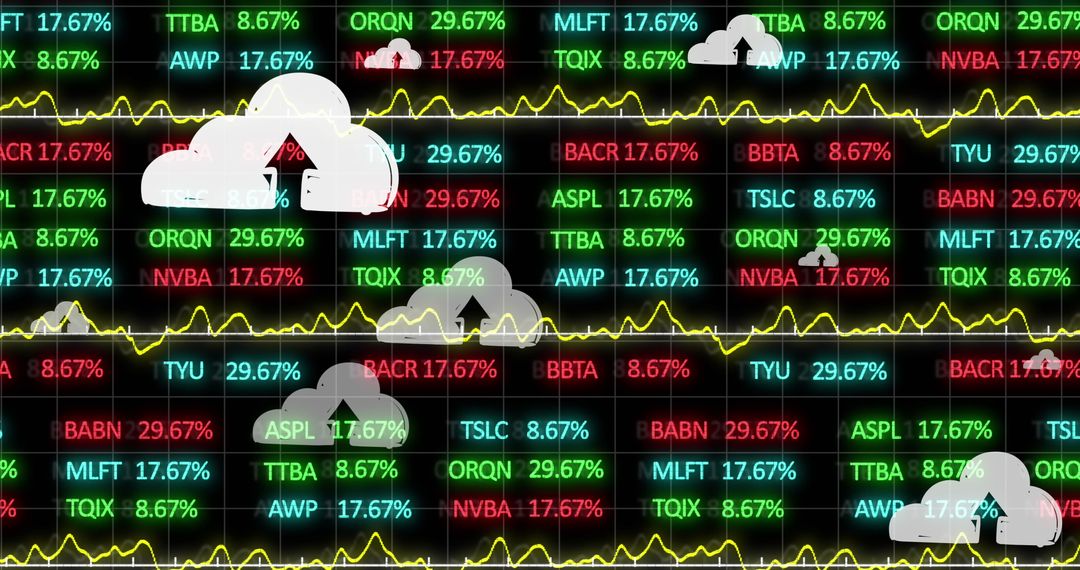
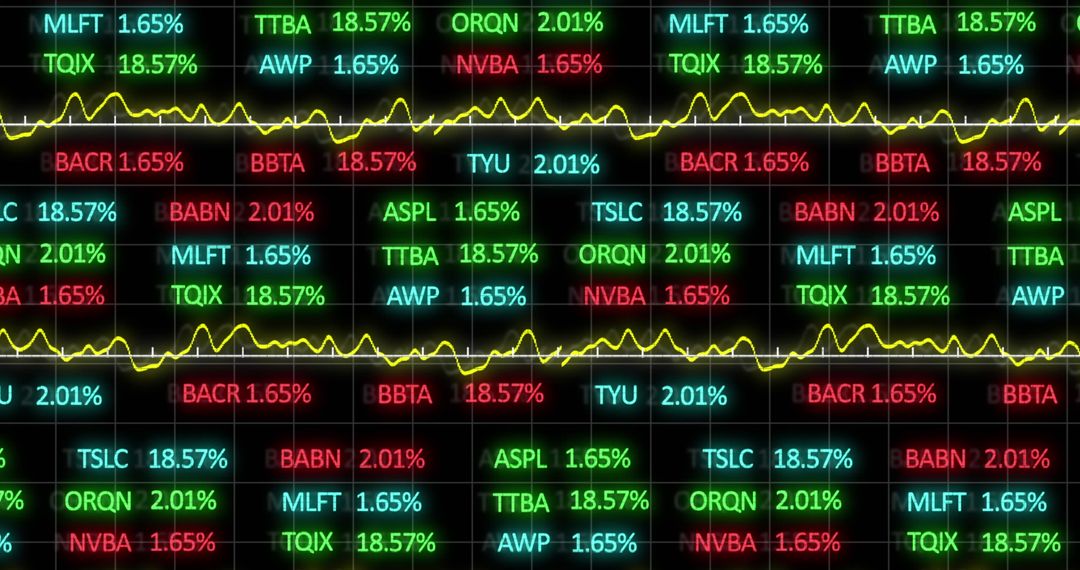
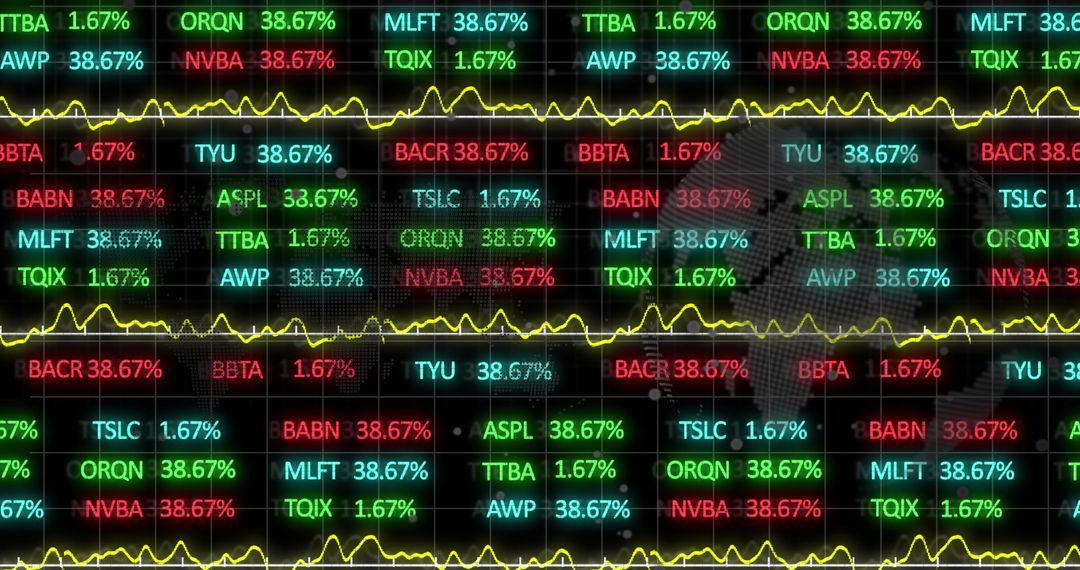
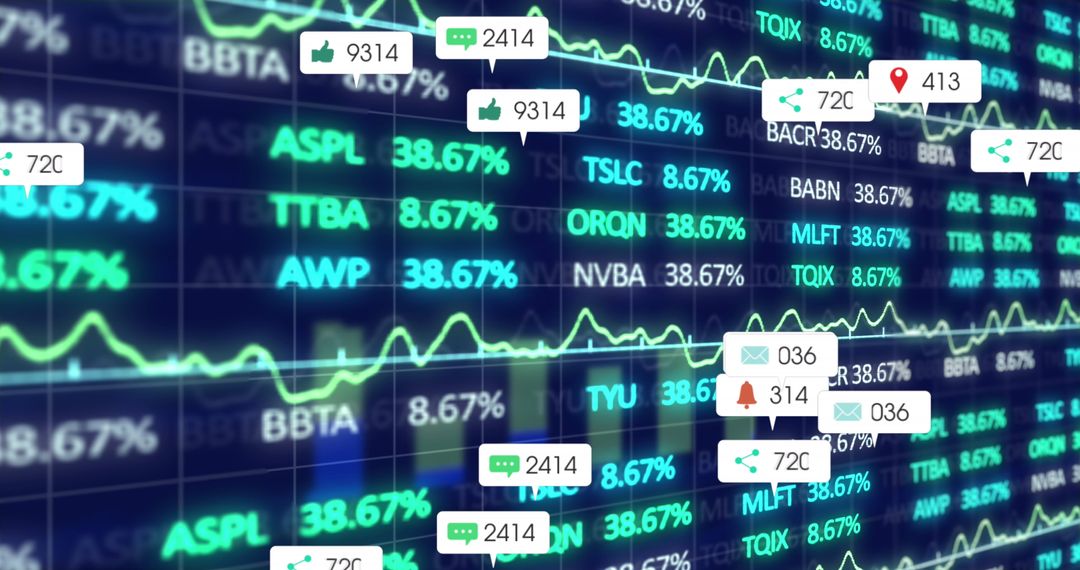
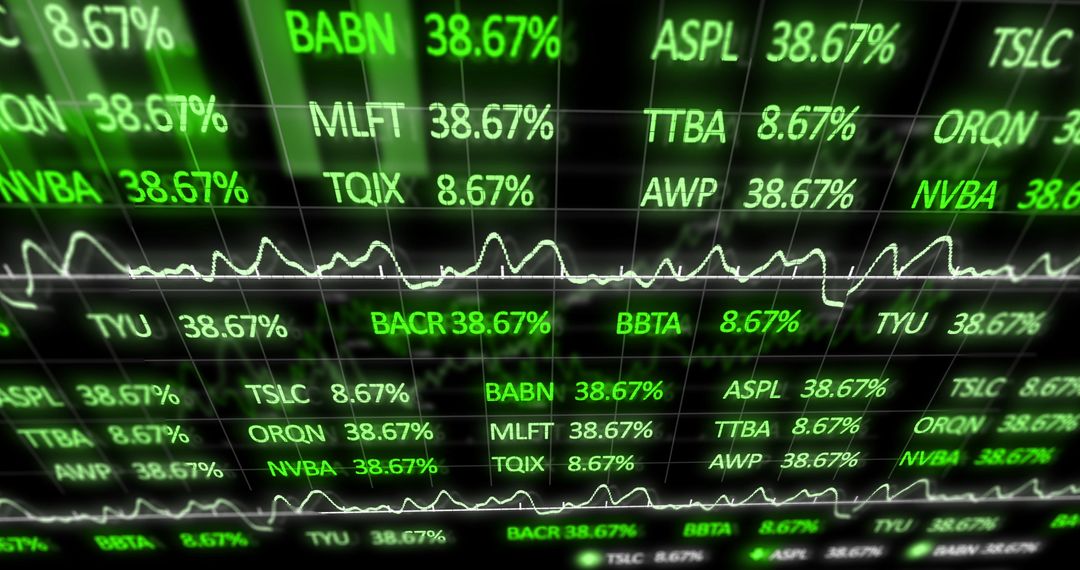
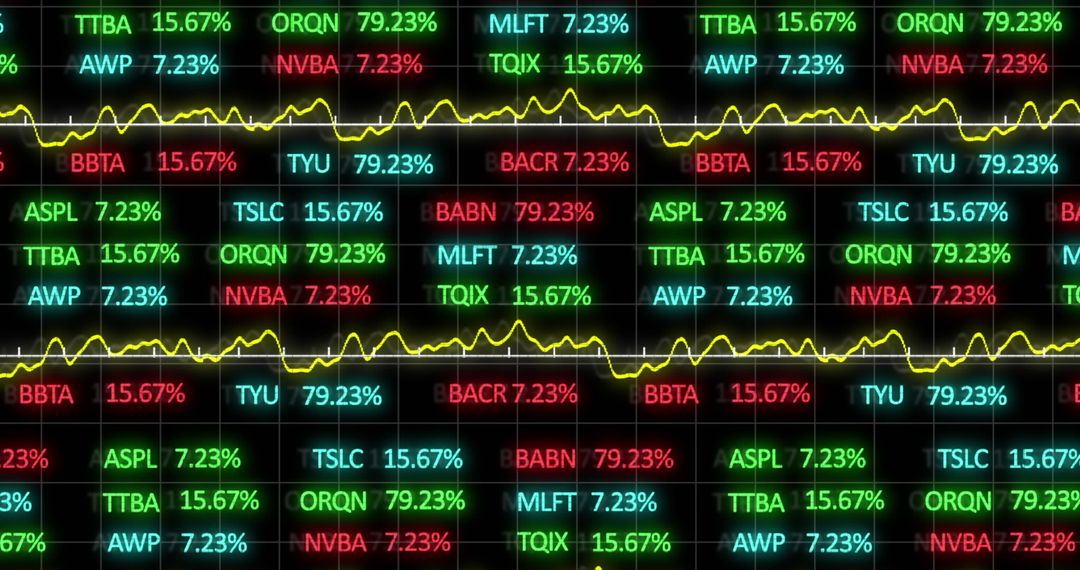
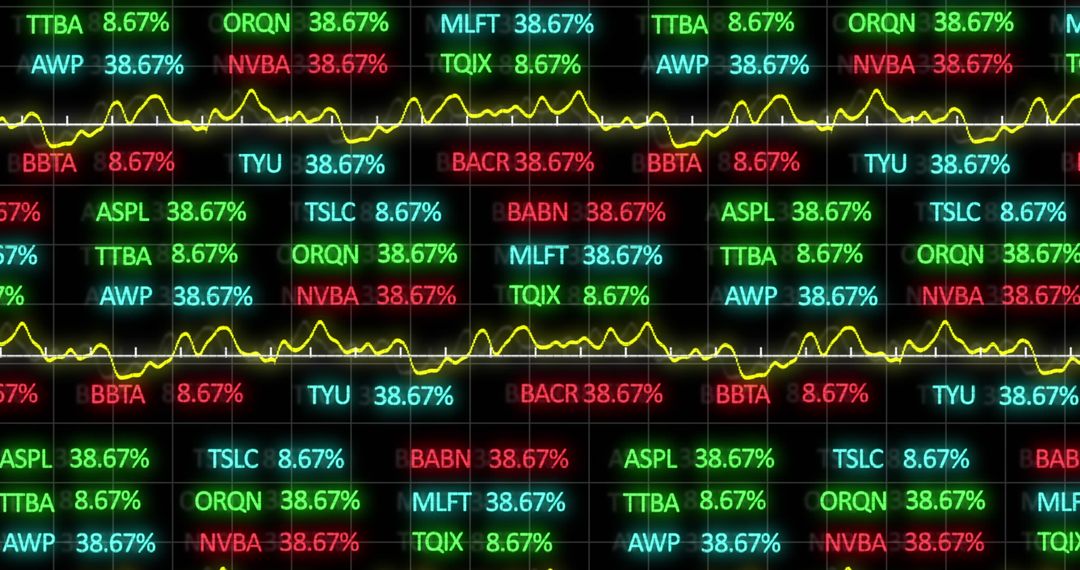
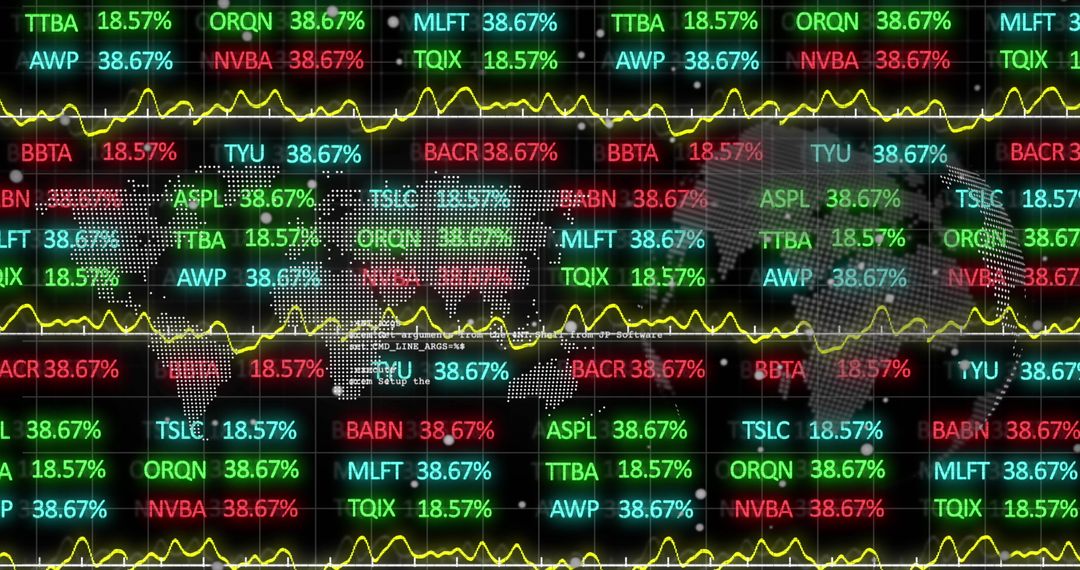
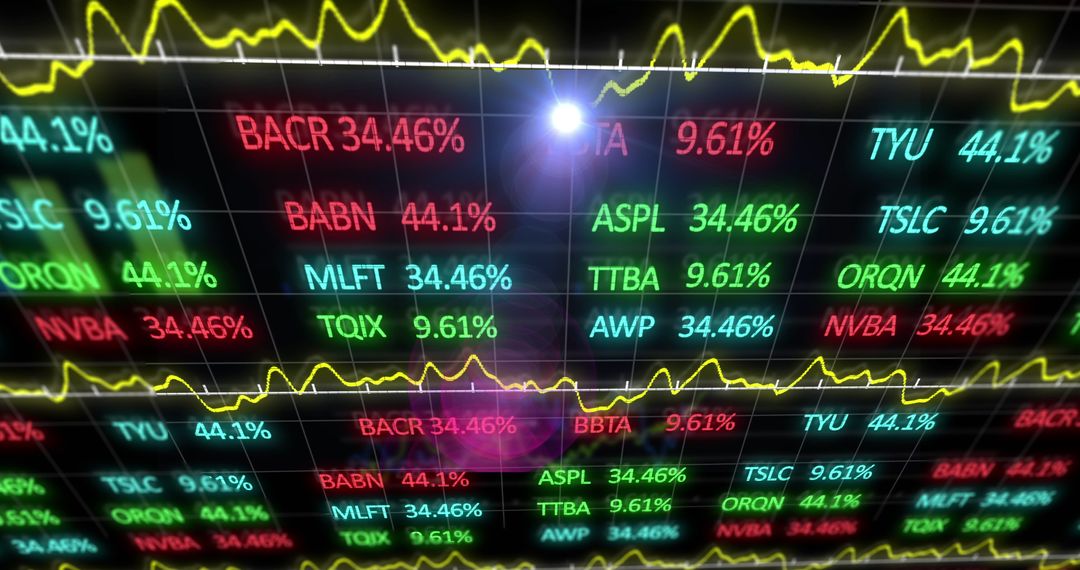
- Dynamic Financial Stock Market Dashboard with Data Analytics
Dynamic Financial Stock Market Dashboard with Data Analytics Image

Displays an array of real-time financial metrics with charts and percentage growth illustrating market trends. Useful for presentations on finance, economic reports, business desk decorations, and educational purposes in teaching economic analytics and stock investments.
Powered by  - Get 15% off with code: PIKWIZARD15


2
downloads
downloads
Tags:
More
Credit Photo
If you would like to credit the Photo, here are some ways you can do so
Text Link
photo Link
<span class="text-link">
<span>
<a target="_blank" href=https://pikwizard.com/photo/dynamic-financial-stock-market-dashboard-with-data-analytics/1a42ccce8a72684d73a1d99c833da1d9/>PikWizard</a>
</span>
</span>
<span class="image-link">
<span
style="margin: 0 0 20px 0; display: inline-block; vertical-align: middle; width: 100%;"
>
<a
target="_blank"
href="https://pikwizard.com/photo/dynamic-financial-stock-market-dashboard-with-data-analytics/1a42ccce8a72684d73a1d99c833da1d9/"
style="text-decoration: none; font-size: 10px; margin: 0;"
>
<img src="https://pikwizard.com/pw/medium/1a42ccce8a72684d73a1d99c833da1d9.jpg" style="margin: 0; width: 100%;" alt="" />
<p style="font-size: 12px; margin: 0;">PikWizard</p>
</a>
</span>
</span>
Free (free of charge)
Free for personal and commercial use.
Author: Authentic Images
Similar Free Stock Images

Premium


Premium


Premium


Premium


Premium


Premium


Premium


Premium


Premium


Premium


Premium


Premium


Premium


Premium


Premium


Premium


Premium


Premium


Premium


Premium


Premium


Premium


Premium


Premium