- Home >
- Stock Photos >
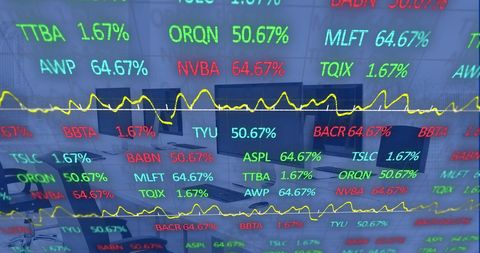
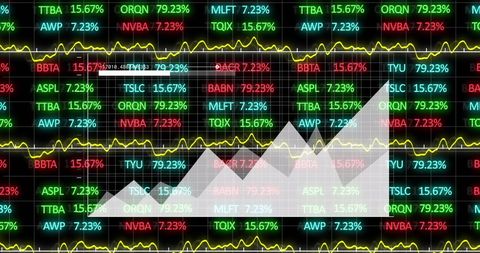
- Dynamic Financial Stock Market Display with Analytical Data
Dynamic Financial Stock Market Display with Analytical Data Image

Image shows layers of dynamic financial data, including stock market trends and analytical graphs in various colors. Use for depicting economic analysis, reports on finance and markets, or presentations related to business performance. Excellent for editorial content focusing on financial trends and investment strategies.
Powered by 


2
downloads
downloads
Tags:
More
Credit Photo
If you would like to credit the Photo, here are some ways you can do so
Text Link
photo Link
<span class="text-link">
<span>
<a target="_blank" href=https://pikwizard.com/photo/dynamic-financial-stock-market-display-with-analytical-data/624147d05aaaba445ce4135129576f6a/>PikWizard</a>
</span>
</span>
<span class="image-link">
<span
style="margin: 0 0 20px 0; display: inline-block; vertical-align: middle; width: 100%;"
>
<a
target="_blank"
href="https://pikwizard.com/photo/dynamic-financial-stock-market-display-with-analytical-data/624147d05aaaba445ce4135129576f6a/"
style="text-decoration: none; font-size: 10px; margin: 0;"
>
<img src="https://pikwizard.com/pw/medium/624147d05aaaba445ce4135129576f6a.jpg" style="margin: 0; width: 100%;" alt="" />
<p style="font-size: 12px; margin: 0;">PikWizard</p>
</a>
</span>
</span>
Free (free of charge)
Free for personal and commercial use.
Author: People Creations
Similar Free Stock Images
Loading...

Premium


Premium


Premium

Premium


Premium


Premium


Premium


Premium


Premium


Premium


Premium


Premium

Premium


Premium


Premium


Premium
Premium


Premium

Premium


Premium

Premium


Premium


Premium


Premium


Premium