
- Home >
- Stock Photos >
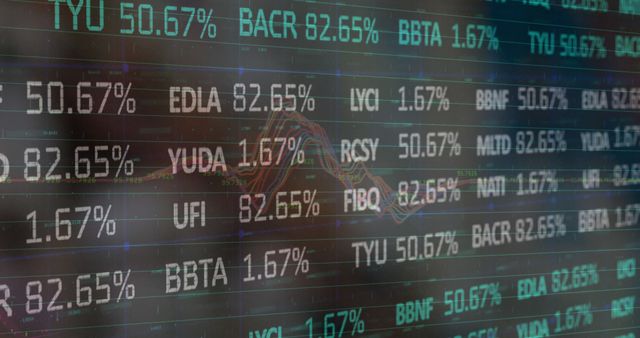
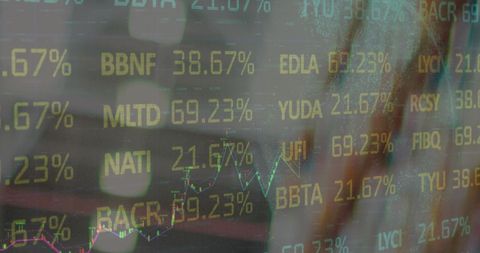
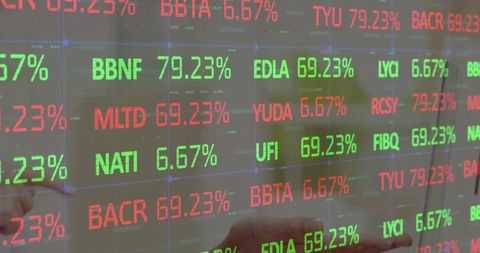
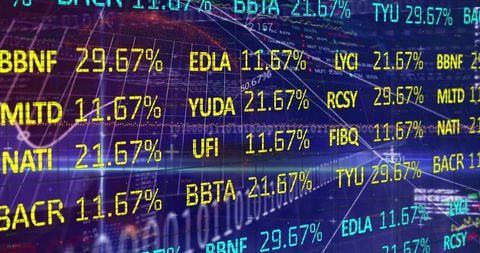
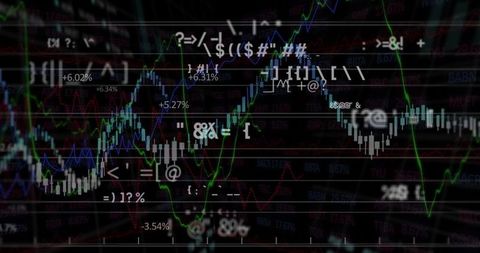
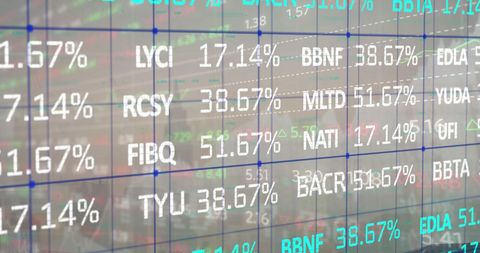
- Dynamic Financial Stock Market Interface with Data Visualizations
Dynamic Financial Stock Market Interface with Data Visualizations Image

This graphic showcases dynamic financial data and statistics being processed in a digital interface. It is ideal for illustrating concepts related to the stock market, trading, and global business finances. Suitable for use in articles, presentations, and projects focusing on economics and data analysis.
Powered by 


downloads
Tags:
More
Credit Photo
If you would like to credit the Photo, here are some ways you can do so
Text Link
photo Link
<span class="text-link">
<span>
<a target="_blank" href=https://pikwizard.com/photo/dynamic-financial-stock-market-interface-with-data-visualizations/ce77158ca6e5c2003ae15b0f777fbfdc/>PikWizard</a>
</span>
</span>
<span class="image-link">
<span
style="margin: 0 0 20px 0; display: inline-block; vertical-align: middle; width: 100%;"
>
<a
target="_blank"
href="https://pikwizard.com/photo/dynamic-financial-stock-market-interface-with-data-visualizations/ce77158ca6e5c2003ae15b0f777fbfdc/"
style="text-decoration: none; font-size: 10px; margin: 0;"
>
<img src="https://pikwizard.com/pw/medium/ce77158ca6e5c2003ae15b0f777fbfdc.jpg" style="margin: 0; width: 100%;" alt="" />
<p style="font-size: 12px; margin: 0;">PikWizard</p>
</a>
</span>
</span>
Free (free of charge)
Free for personal and commercial use.
Author: Awesome Content
Similar Free Stock Images

Premium


Premium


Premium


Premium


Premium


Premium

Premium


Premium

Premium


Premium


Premium


Premium

Premium


Premium


Premium


Premium


Premium


Premium


Premium

Premium

Premium


Premium


Premium

Premium

Premium


Explore More Free Stock Images