
- Home >
- Stock Photos >
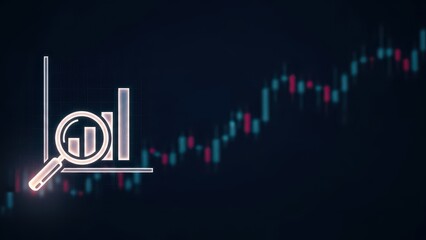
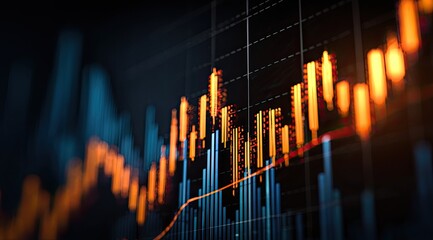
- Dynamic Financial Trading Chart with Candlestick Graphs
Dynamic Financial Trading Chart with Candlestick Graphs Image

Displaying candlestick bars and line plots on a digital trading platform, this visual illustrates the fluctuations in financial markets. Indicators such as percent markers are prominently visible, serving as a tool for analyzing market trends and investment decisions. Perfect for use in financial reports, trading seminars, or investment courses for demonstrating concepts of market analysis and trading strategies.
Powered by 


downloads
Tags:
More
Credit Photo
If you would like to credit the Photo, here are some ways you can do so
Text Link
photo Link
<span class="text-link">
<span>
<a target="_blank" href=https://pikwizard.com/photo/dynamic-financial-trading-chart-with-candlestick-graphs/e36ce1db664dfd58e3d5a68a5154099f/>PikWizard</a>
</span>
</span>
<span class="image-link">
<span
style="margin: 0 0 20px 0; display: inline-block; vertical-align: middle; width: 100%;"
>
<a
target="_blank"
href="https://pikwizard.com/photo/dynamic-financial-trading-chart-with-candlestick-graphs/e36ce1db664dfd58e3d5a68a5154099f/"
style="text-decoration: none; font-size: 10px; margin: 0;"
>
<img src="https://pikwizard.com/pw/medium/e36ce1db664dfd58e3d5a68a5154099f.jpg" style="margin: 0; width: 100%;" alt="" />
<p style="font-size: 12px; margin: 0;">PikWizard</p>
</a>
</span>
</span>
Free (free of charge)
Free for personal and commercial use.
Author: People Creations
Similar Free Stock Images

Premium


Premium

Premium


Premium


Premium


Premium


Premium


Premium


Premium

Premium


Premium


Premium


Premium
Premium

Premium


Premium


Premium


Premium


Premium


Premium


Premium

Premium

Premium


Premium


Premium


Explore More Free Stock Images