- Home >
- Stock Photos >
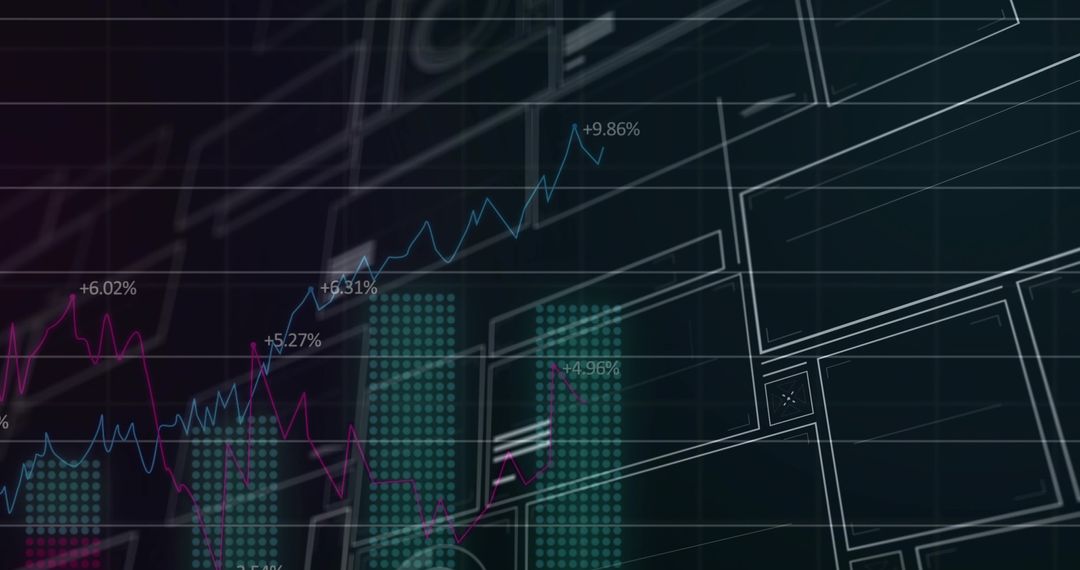
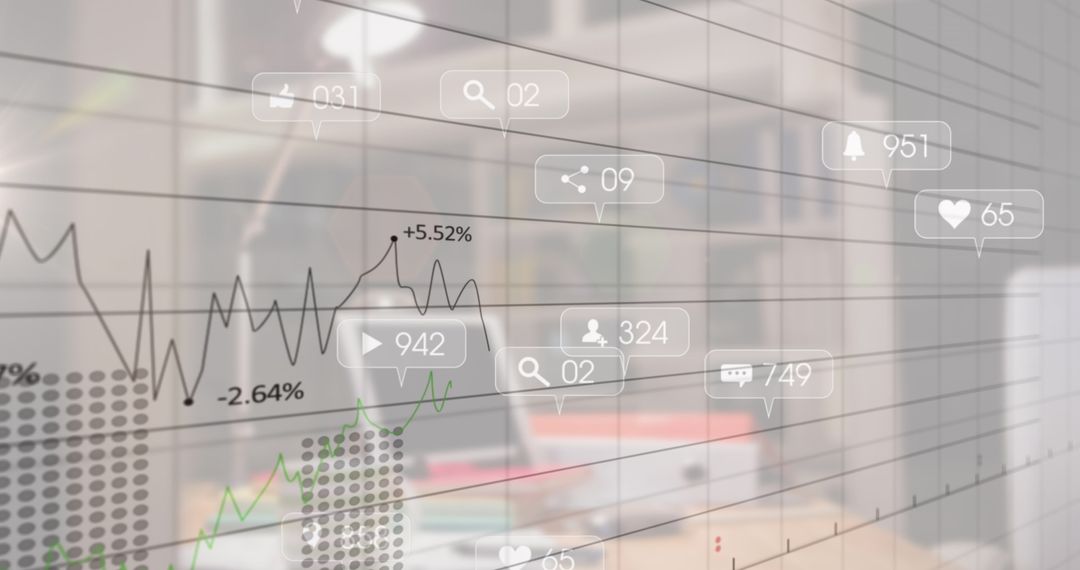
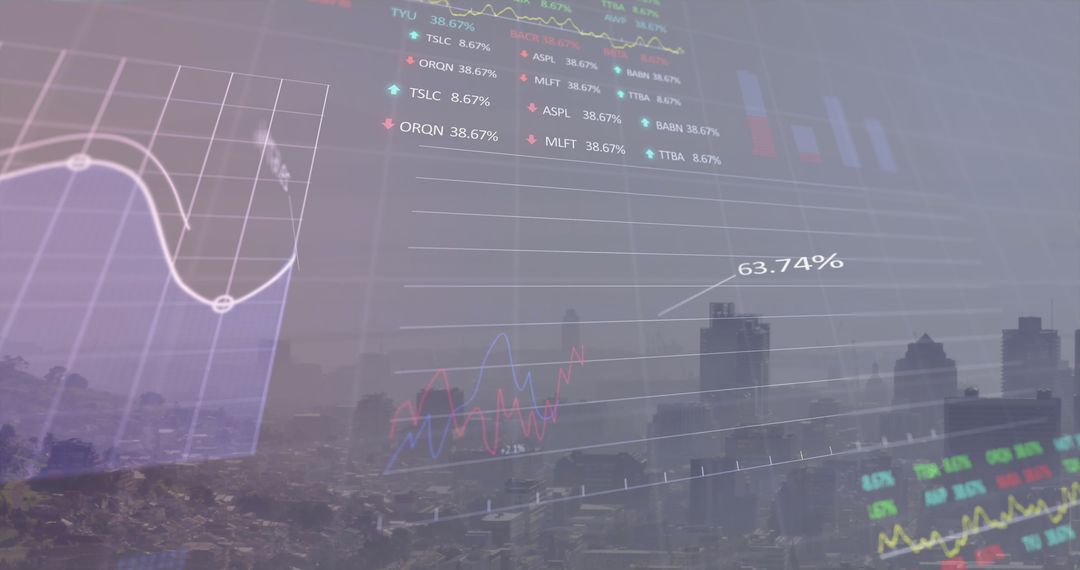
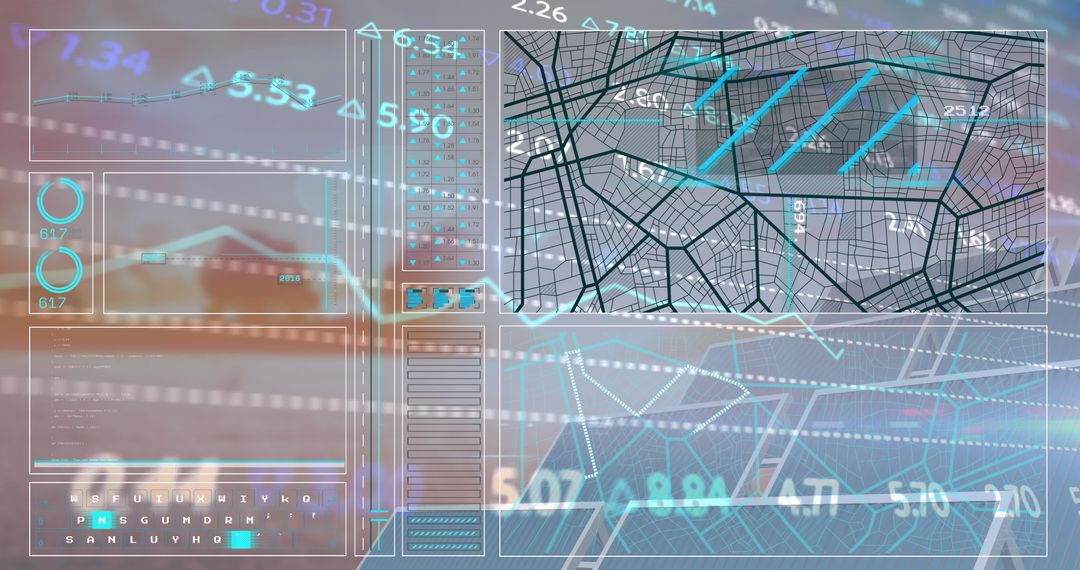
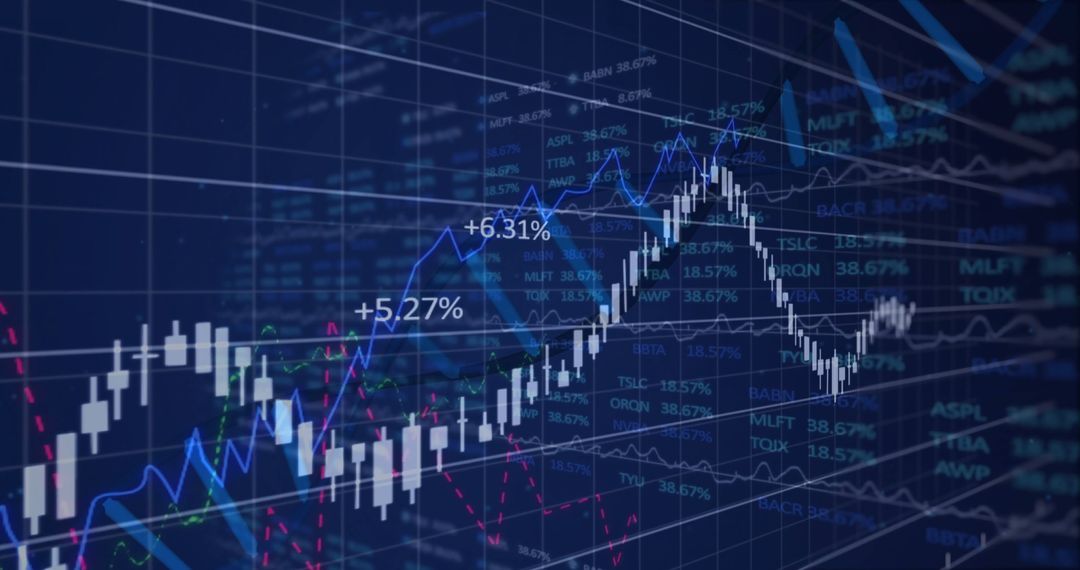
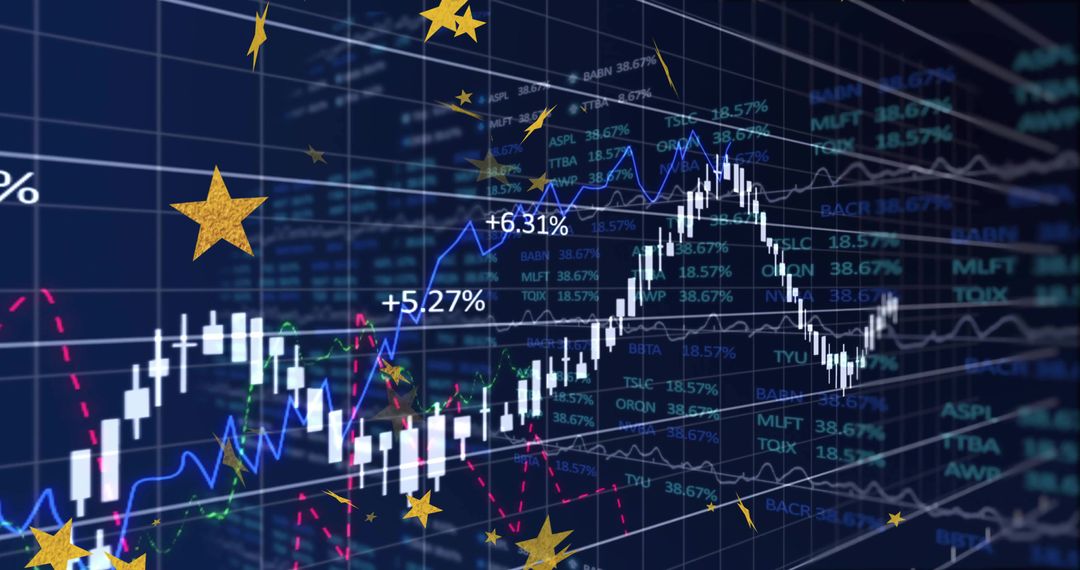
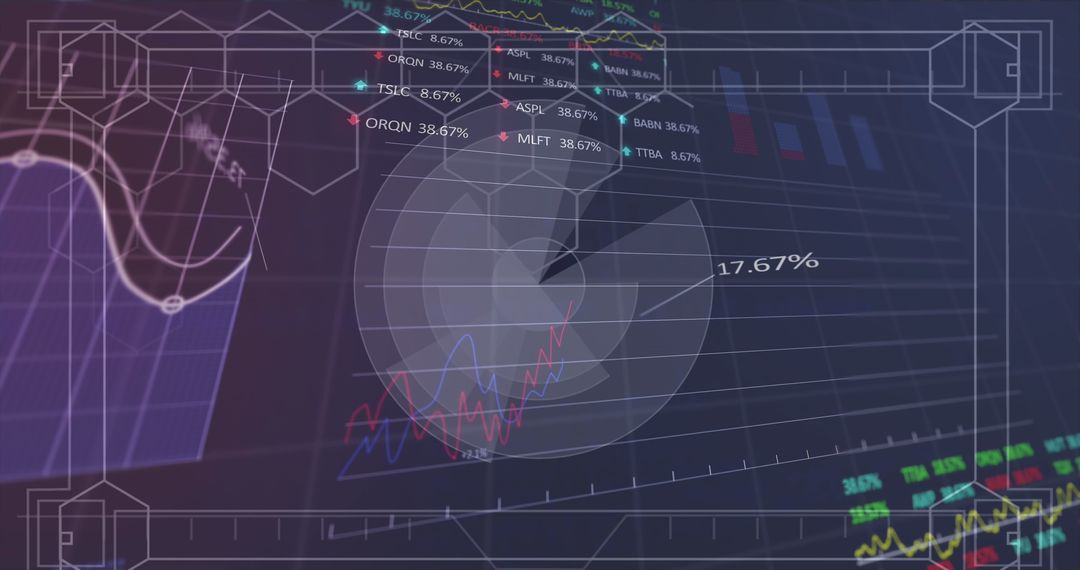
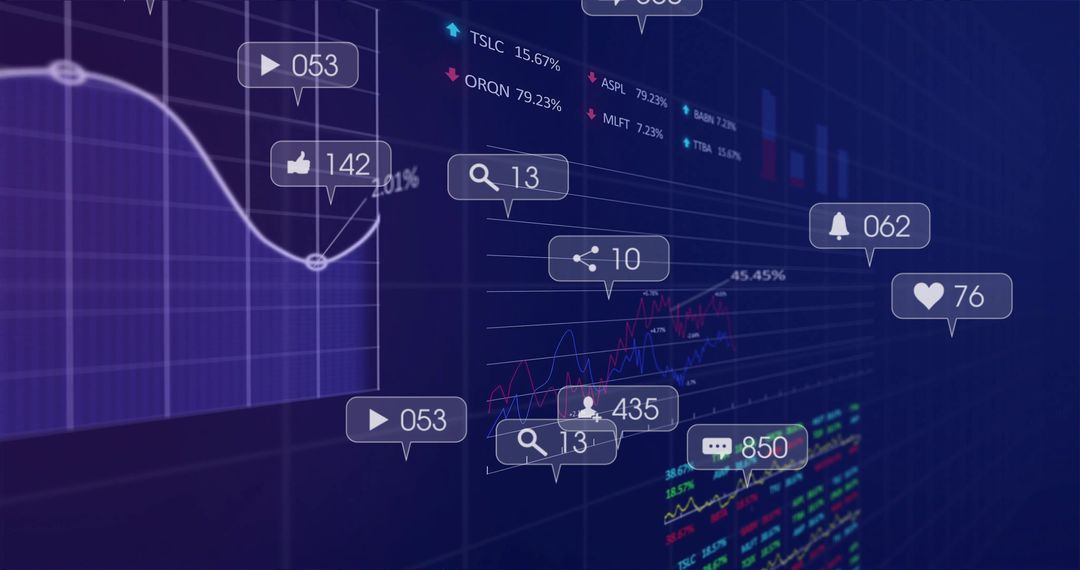
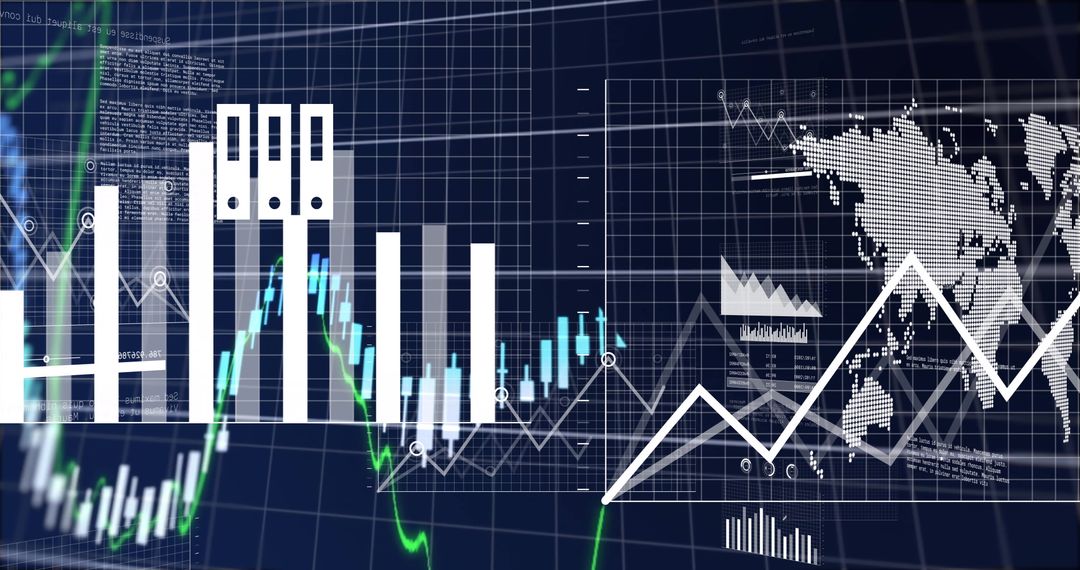
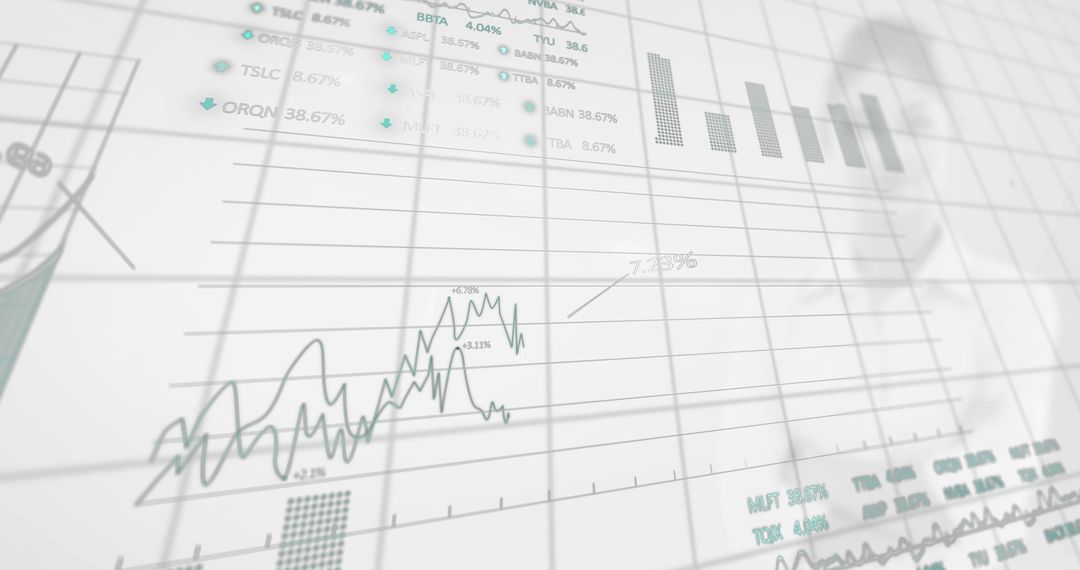
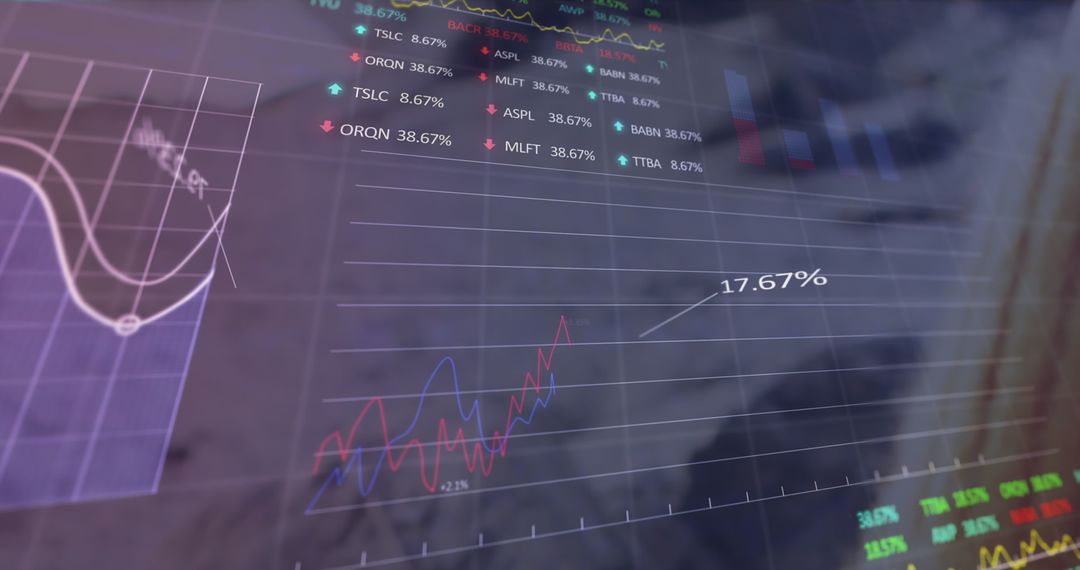
- Dynamic Financial Trading Dashboard with Neon Lines and Candlestick Charts
Dynamic Financial Trading Dashboard with Neon Lines and Candlestick Charts Image

Dark, vibrant dashboard with dynamic market data ideal for videos about stock trading, data analysis, or financial technology presentations. Perfectly illustrates complex financial analytics through modern visualization techniques for educational webinars or fintech app designs.
Powered by  - Get 15% off with code: PIKWIZARD15


0
downloads
downloads
Tags:
More
Credit Photo
If you would like to credit the Photo, here are some ways you can do so
Text Link
photo Link
<span class="text-link">
<span>
<a target="_blank" href=https://pikwizard.com/photo/dynamic-financial-trading-dashboard-with-neon-lines-and-candlestick-charts/3518a5bb34e3f397500c4f2acfa8db3e/>PikWizard</a>
</span>
</span>
<span class="image-link">
<span
style="margin: 0 0 20px 0; display: inline-block; vertical-align: middle; width: 100%;"
>
<a
target="_blank"
href="https://pikwizard.com/photo/dynamic-financial-trading-dashboard-with-neon-lines-and-candlestick-charts/3518a5bb34e3f397500c4f2acfa8db3e/"
style="text-decoration: none; font-size: 10px; margin: 0;"
>
<img src="https://pikwizard.com/pw/medium/3518a5bb34e3f397500c4f2acfa8db3e.jpg" style="margin: 0; width: 100%;" alt="" />
<p style="font-size: 12px; margin: 0;">PikWizard</p>
</a>
</span>
</span>
Free (free of charge)
Free for personal and commercial use.
Author: Creative Art
Similar Free Stock Images

Premium


Premium


Premium


Premium


Premium


Premium


Premium


Premium


Premium


Premium


Premium


Premium


Premium


Premium


Premium


Premium


Premium


Premium


Premium


Premium


Premium


Premium


Premium


Premium