- Home >
- Stock Photos >
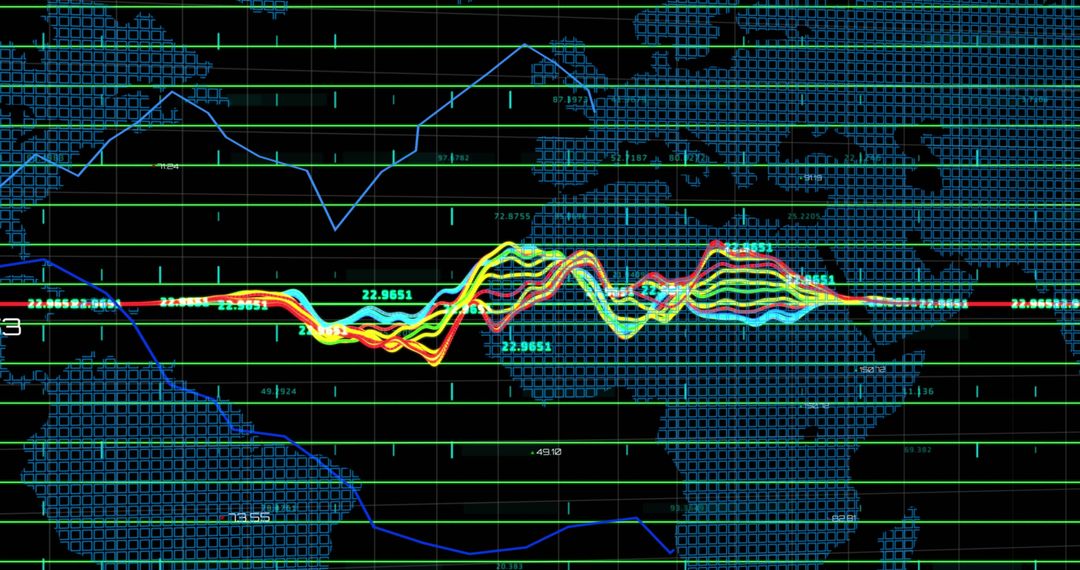
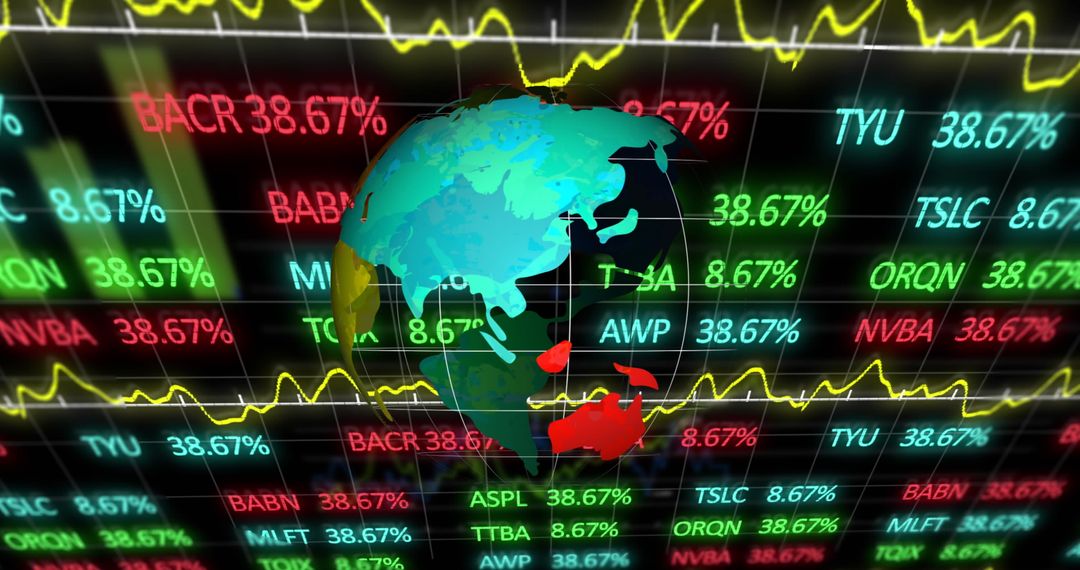
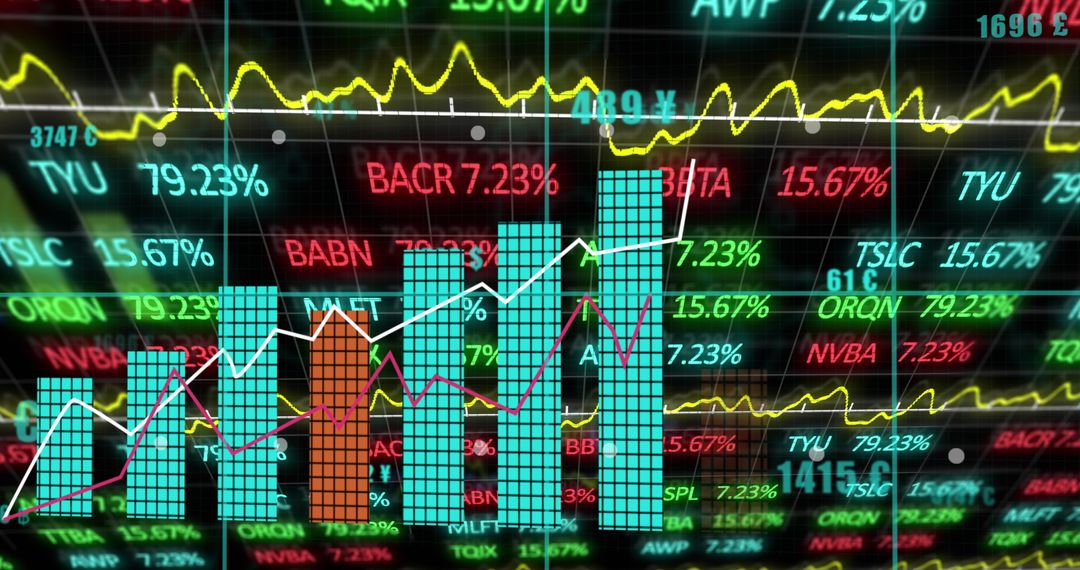
- Dynamic Financial Trading Data Visualization with Charts and Graphs
Dynamic Financial Trading Data Visualization with Charts and Graphs Image
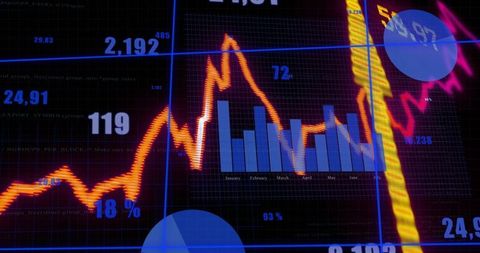
Depicting vibrant financial trends with a combination of line graphs, bar charts, and numerical data, making it perfect for use in presentations on finance analytics, investment reports, stock market trajectory insights, fintech solutions, and educational materials about economic forecasting.
Powered by  - Get 15% off with code: PIKWIZARD15


0
downloads
downloads
Tags:
More
Credit Photo
If you would like to credit the Photo, here are some ways you can do so
Text Link
photo Link
<span class="text-link">
<span>
<a target="_blank" href=https://pikwizard.com/photo/dynamic-financial-trading-data-visualization-with-charts-and-graphs/58593af6e3f58eacbe1ad2def33f7c60/>PikWizard</a>
</span>
</span>
<span class="image-link">
<span
style="margin: 0 0 20px 0; display: inline-block; vertical-align: middle; width: 100%;"
>
<a
target="_blank"
href="https://pikwizard.com/photo/dynamic-financial-trading-data-visualization-with-charts-and-graphs/58593af6e3f58eacbe1ad2def33f7c60/"
style="text-decoration: none; font-size: 10px; margin: 0;"
>
<img src="https://pikwizard.com/pw/medium/58593af6e3f58eacbe1ad2def33f7c60.jpg" style="margin: 0; width: 100%;" alt="" />
<p style="font-size: 12px; margin: 0;">PikWizard</p>
</a>
</span>
</span>
Free (free of charge)
Free for personal and commercial use.
Author: Creative Art
Similar Free Stock Images

Premium


Premium


Premium


Premium


Premium


Premium


Premium


Premium


Premium


Premium


Premium


Premium


Premium


Premium


Premium


Premium


Premium


Premium


Premium


Premium


Premium


Premium


Premium


Premium