
- Home >
- Stock Photos >
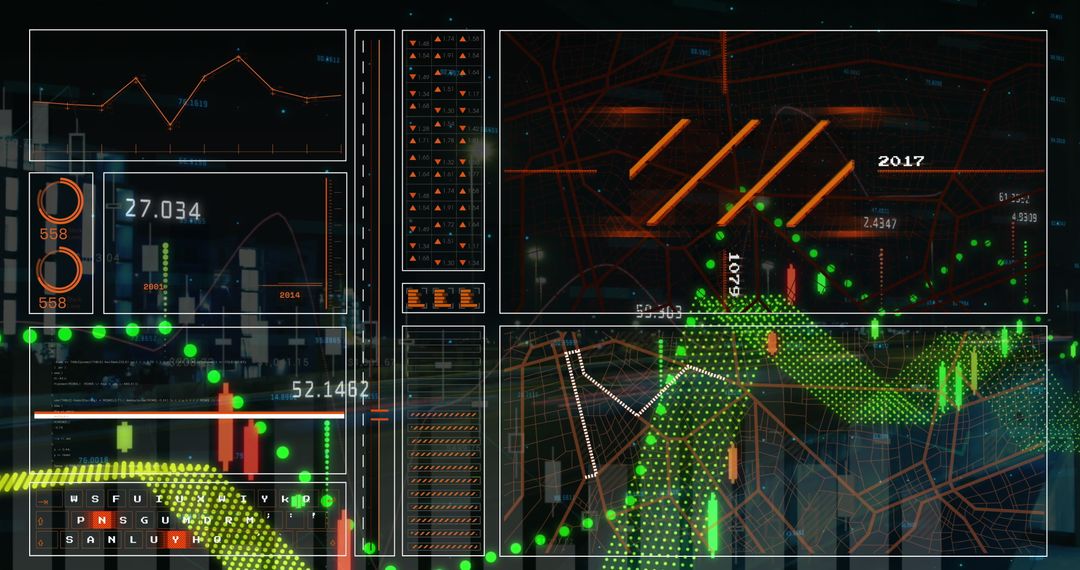
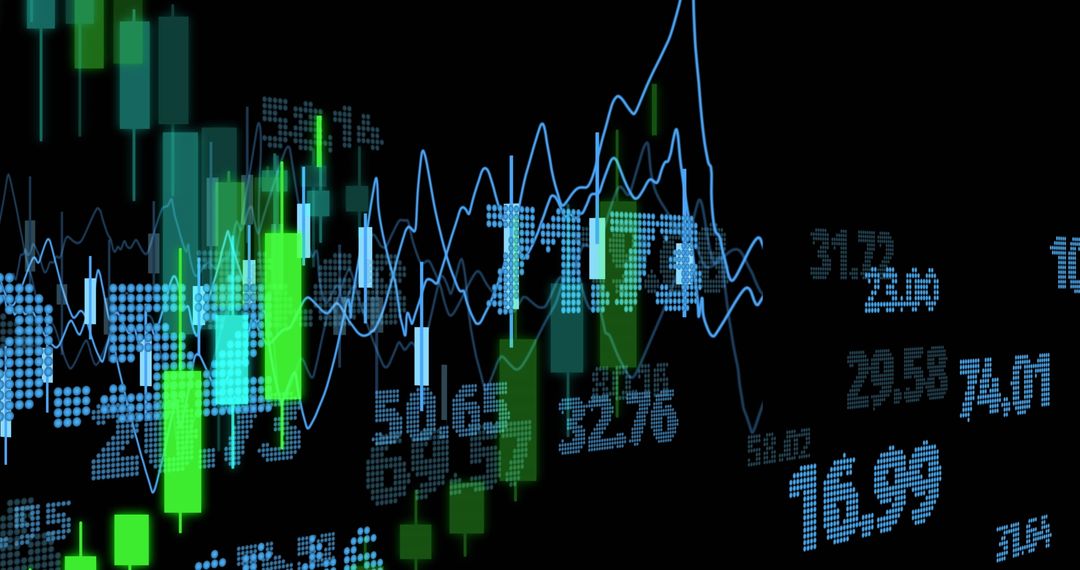
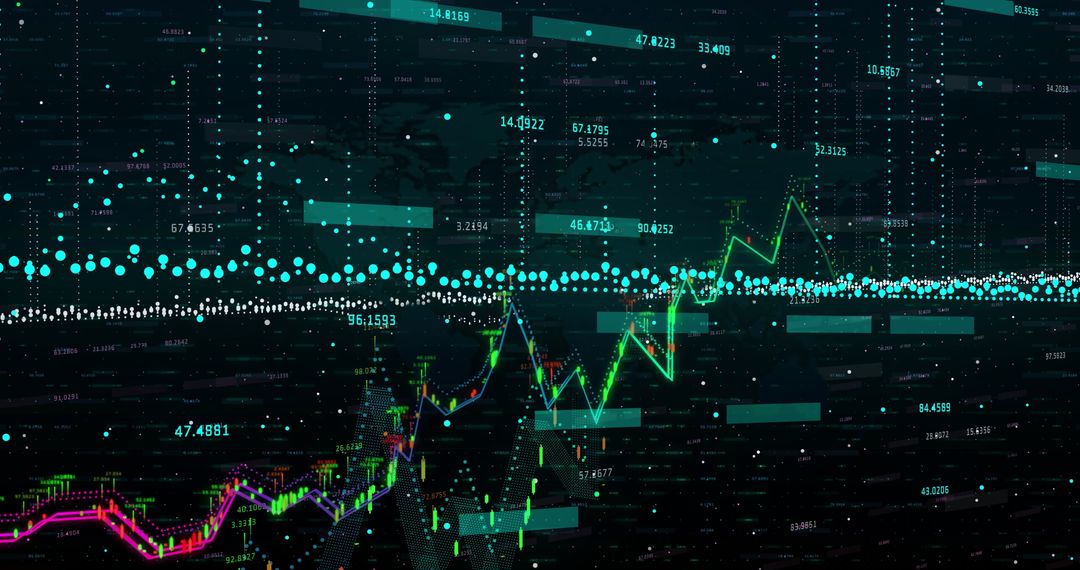
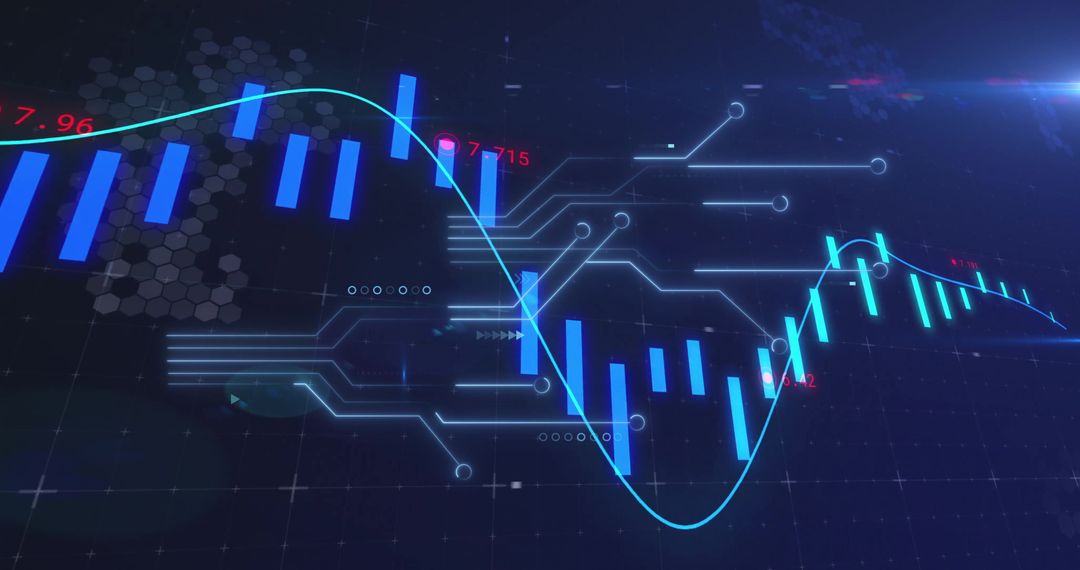
- Dynamic Financial Trading Data with Candlesticks and Trend Lines
Dynamic Financial Trading Data with Candlesticks and Trend Lines Image
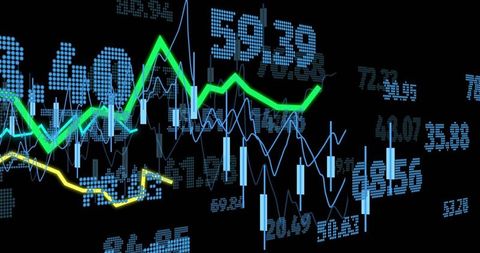
Shows dynamic real-time trading information with blue candlestick patterns and green trend lines overlaid by numeric figures, representing data analytics in stock trading. Useful for financial news articles, investment analysis reports, or presentations on market trends and technology in finance.
Powered by  - Get 15% off with code: PIKWIZARD15


4
downloads
downloads
Tags:
More
Credit Photo
If you would like to credit the Photo, here are some ways you can do so
Text Link
photo Link
<span class="text-link">
<span>
<a target="_blank" href=https://pikwizard.com/photo/dynamic-financial-trading-data-with-candlesticks-and-trend-lines/29edf93c7635419736f840ee431c63cb/>PikWizard</a>
</span>
</span>
<span class="image-link">
<span
style="margin: 0 0 20px 0; display: inline-block; vertical-align: middle; width: 100%;"
>
<a
target="_blank"
href="https://pikwizard.com/photo/dynamic-financial-trading-data-with-candlesticks-and-trend-lines/29edf93c7635419736f840ee431c63cb/"
style="text-decoration: none; font-size: 10px; margin: 0;"
>
<img src="https://pikwizard.com/pw/medium/29edf93c7635419736f840ee431c63cb.jpg" style="margin: 0; width: 100%;" alt="" />
<p style="font-size: 12px; margin: 0;">PikWizard</p>
</a>
</span>
</span>
Free (free of charge)
Free for personal and commercial use.
Author: People Creations
Similar Free Stock Images
Premium


Premium


Premium


Premium


Premium


Premium


Premium


Premium


Premium


Premium


Premium


Premium


Premium


Premium


Premium


Premium


Premium


Premium


Premium


Premium


Premium


Premium


Premium


Premium

