
- Home >
- Free Stock Photos & Images >
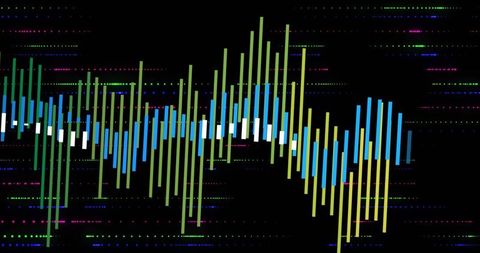
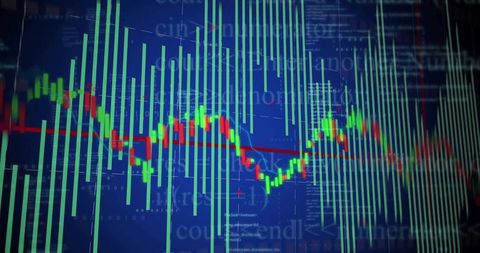
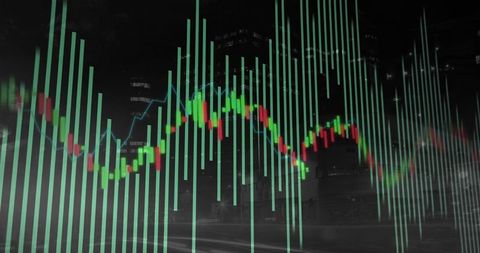
- Dynamic Financial Trading Display with Neon Grid Pattern
Dynamic Financial Trading Display with Neon Grid Pattern Free Stock Image

Visual depicting a vibrant financial trading display featuring a neon grid and a mix of green bars, red candlesticks, and a blue trend line. Ideal for illustrating concepts of financial analysis, economic trends, and the stock market. Useful for presentations on investment strategies, technological advances in data visualization, or educational materials on financial markets.
Powered by  - Get 15% off with code: PIKWIZARD15


downloads
Tags:
More
Credit Photo
If you would like to credit the Photo, here are some ways you can do so
Text Link
photo Link
<span class="text-link">
<span>
<a target="_blank" href=https://pikwizard.com/photo/dynamic-financial-trading-display-with-neon-grid-pattern/6f995c6ae4eb721772e57150bc3811e1/>PikWizard</a>
</span>
</span>
<span class="image-link">
<span
style="margin: 0 0 20px 0; display: inline-block; vertical-align: middle; width: 100%;"
>
<a
target="_blank"
href="https://pikwizard.com/photo/dynamic-financial-trading-display-with-neon-grid-pattern/6f995c6ae4eb721772e57150bc3811e1/"
style="text-decoration: none; font-size: 10px; margin: 0;"
>
<img src="https://thumbs.wbm.im/pw/medium/6f995c6ae4eb721772e57150bc3811e1.jpg" style="margin: 0; width: 100%;" alt="Dynamic Financial Trading Display with Neon Grid Pattern" />
<p style="font-size: 12px; margin: 0;">PikWizard</p>
</a>
</span>
</span>
Free (free of charge)
Free for personal and commercial use.
Author: Authentic Images
Similar Free Stock Images


Premium


Premium


Premium


Premium


Premium


Premium


Premium


Premium


Premium


Premium


Premium


Premium


Premium


Premium


Premium


Premium


Premium


Premium


Premium


Premium


Premium


Premium


Premium


Premium


Premium

Explore More Free Stock Images