- Home >
- Stock Photos >
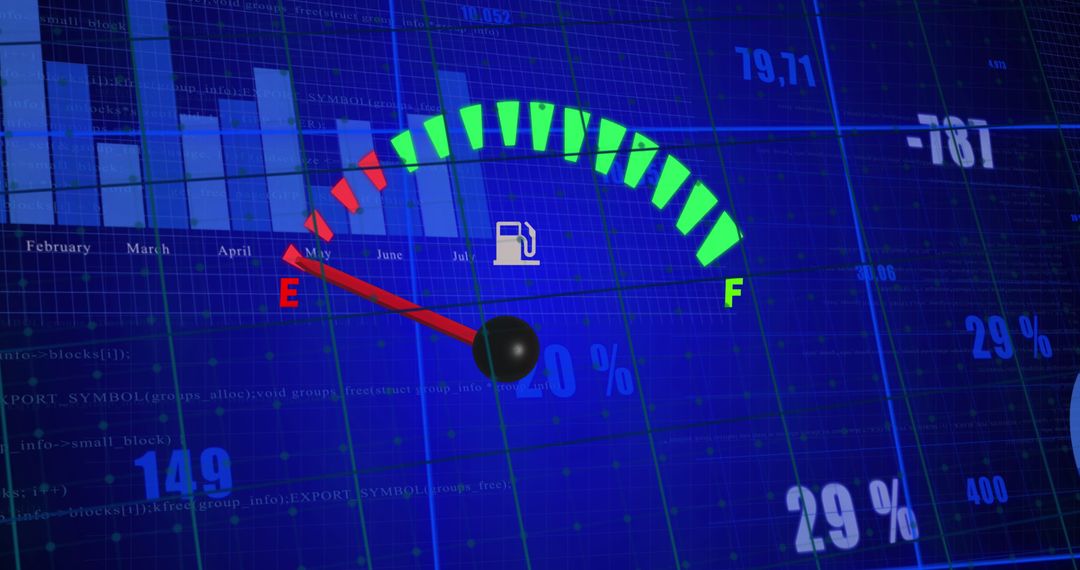
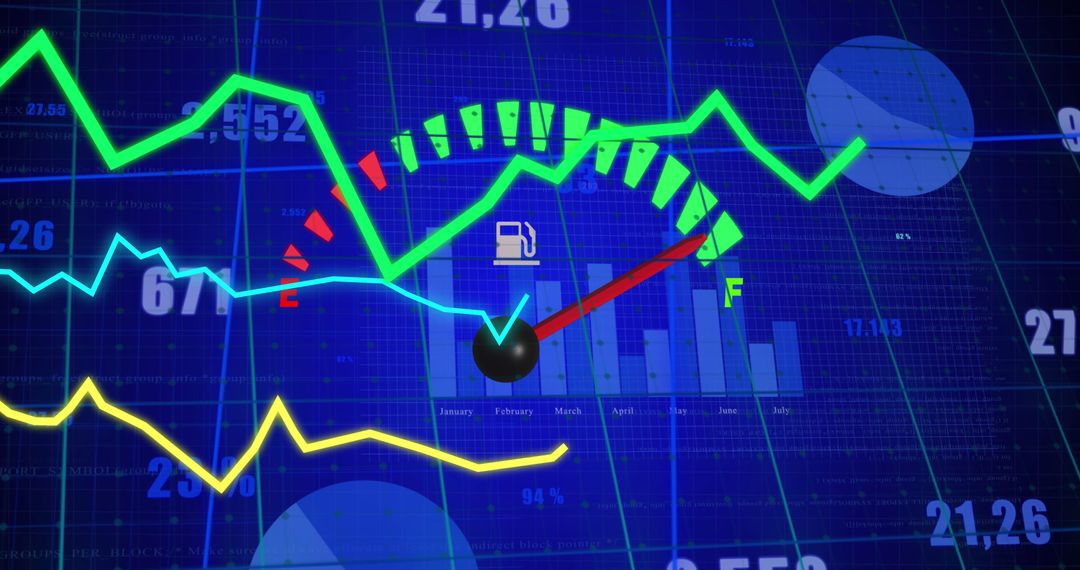
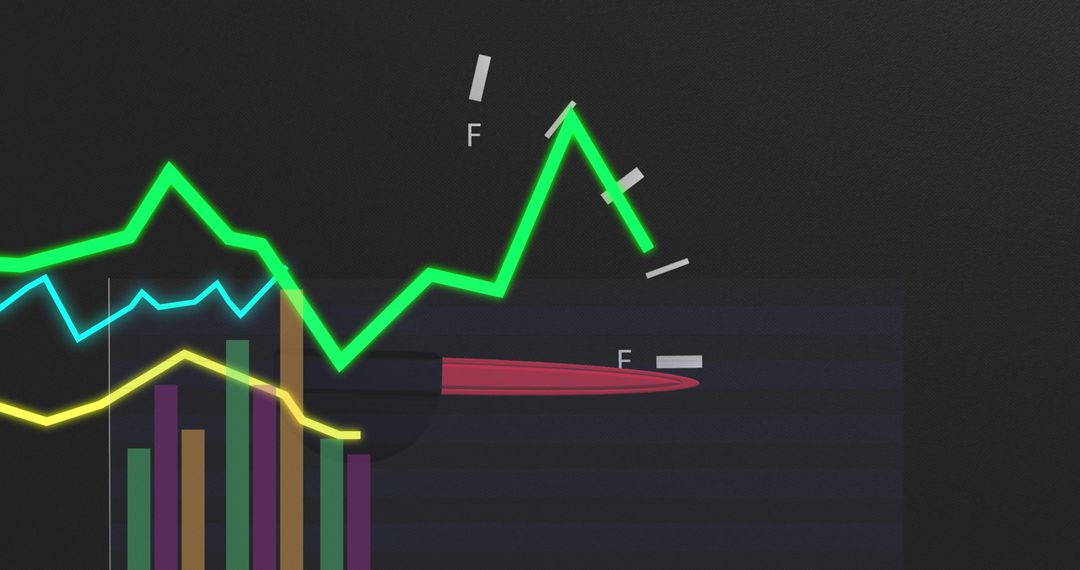
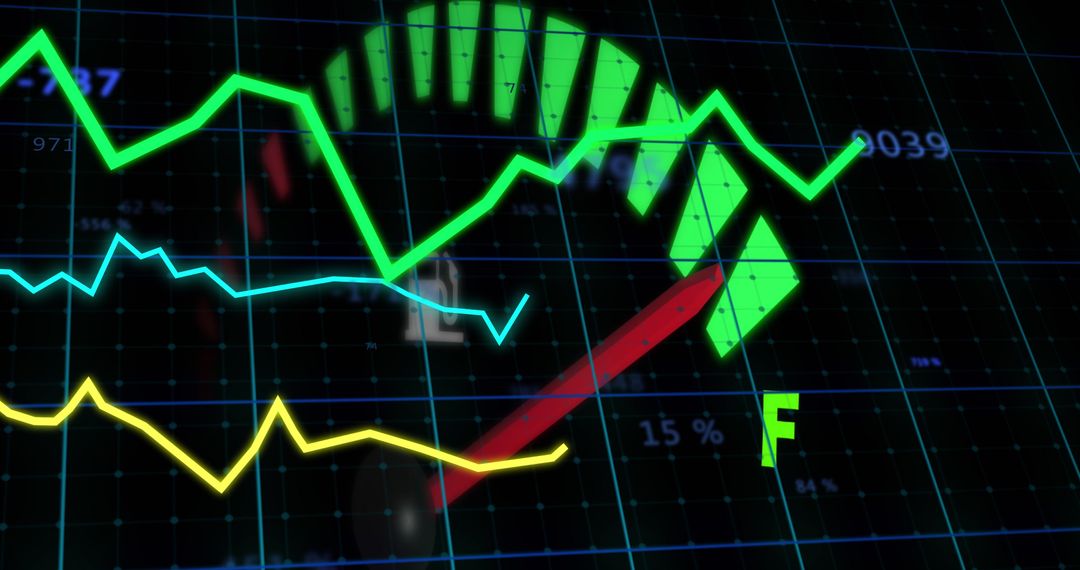
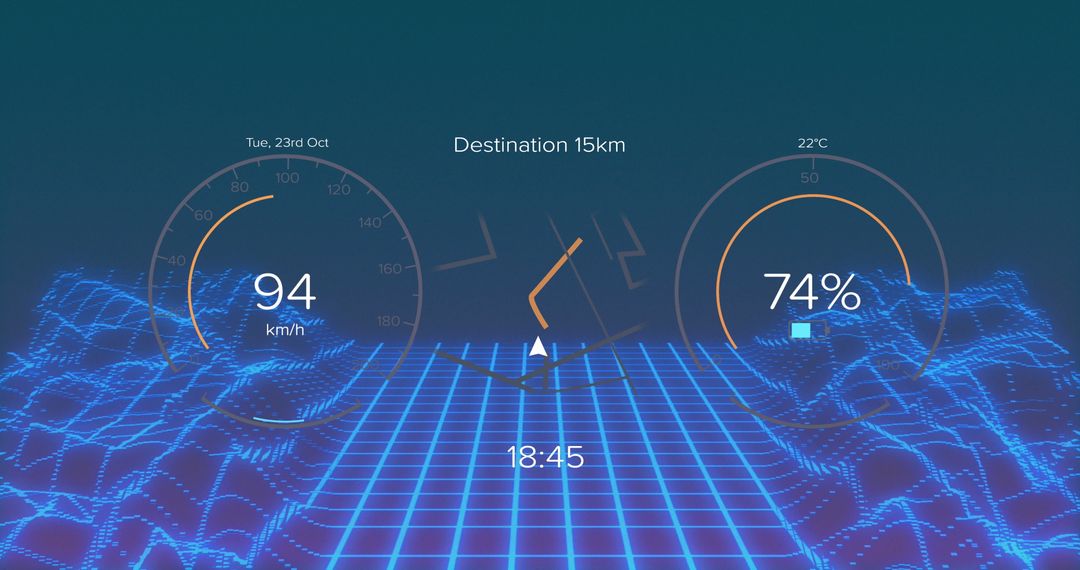
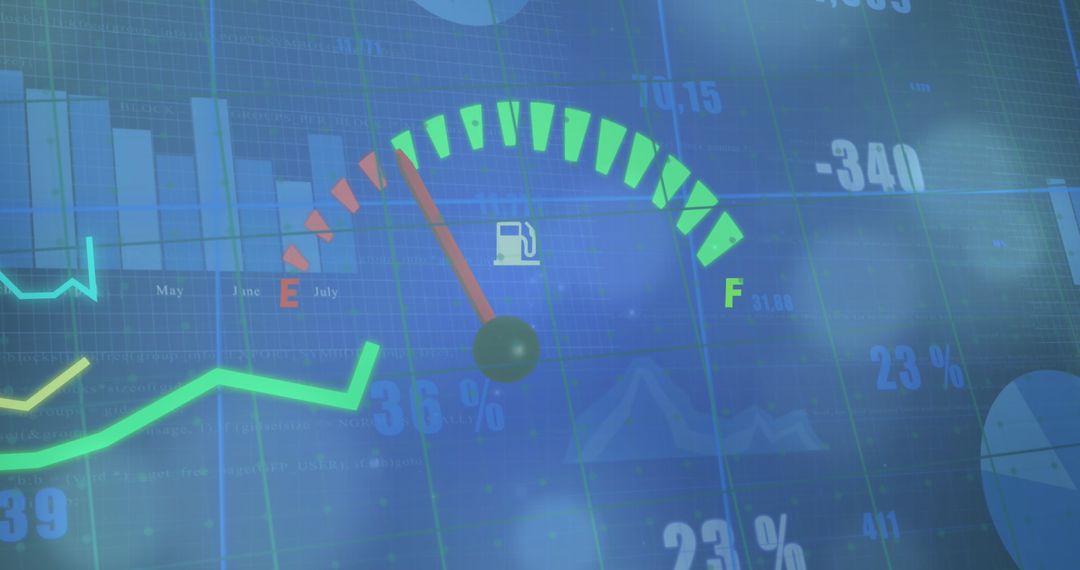
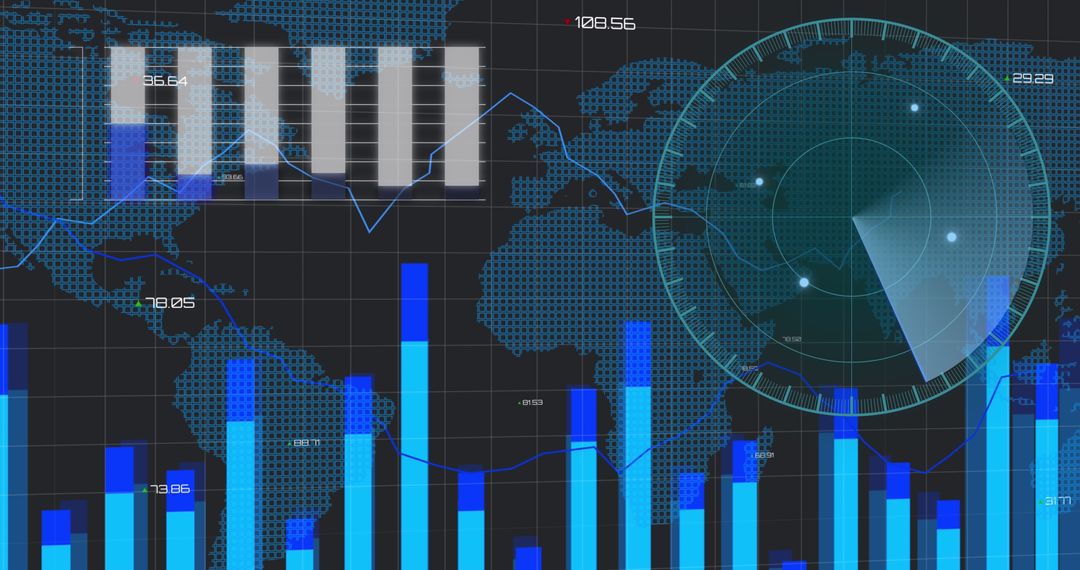
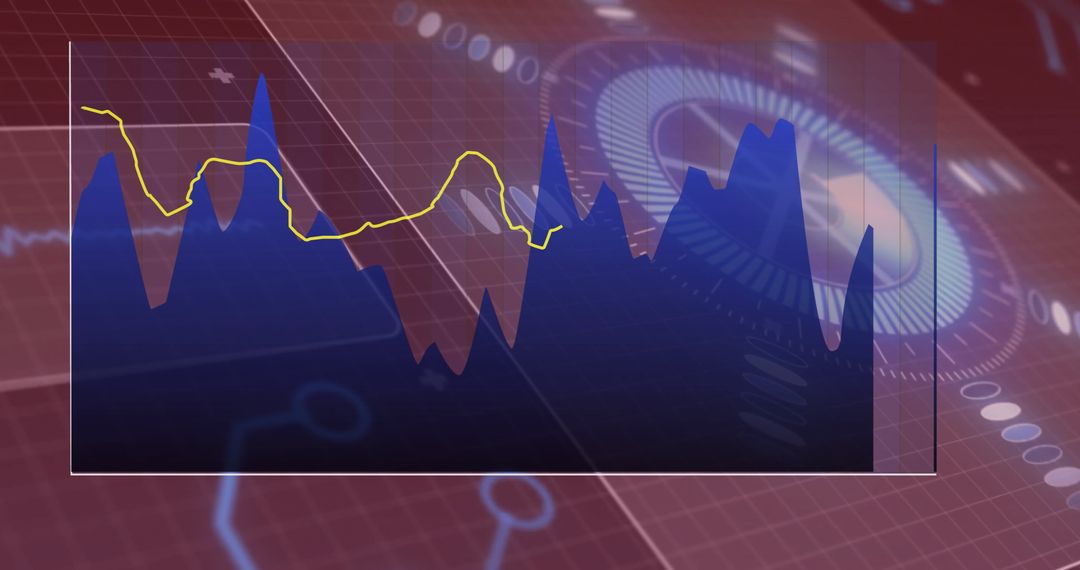
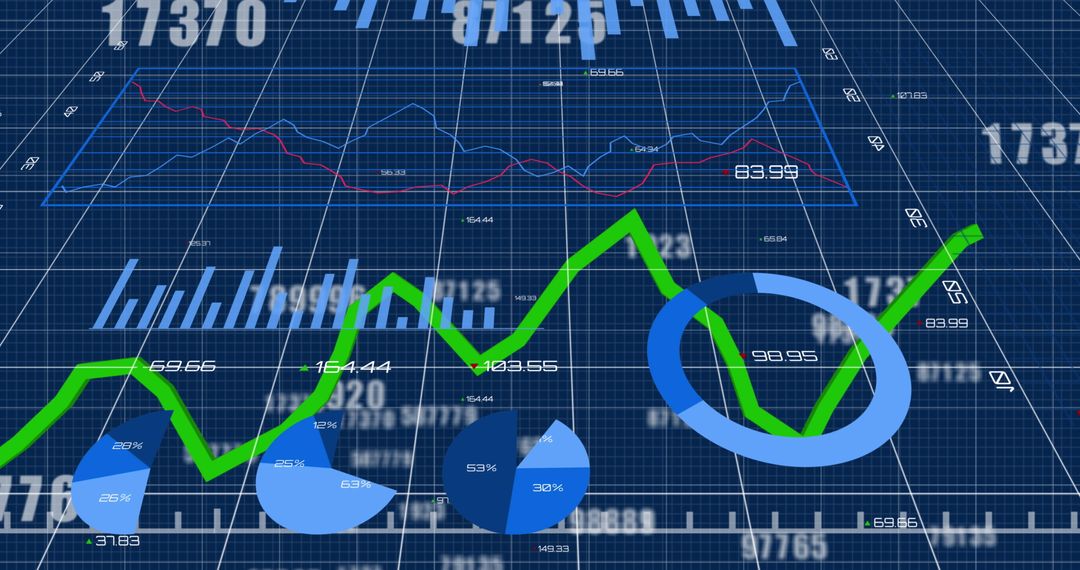
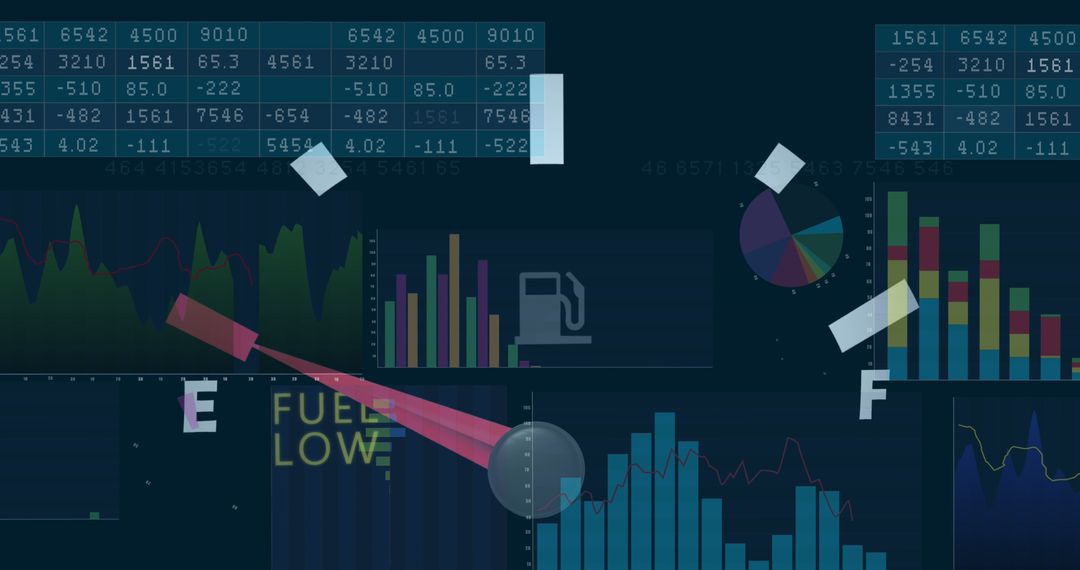
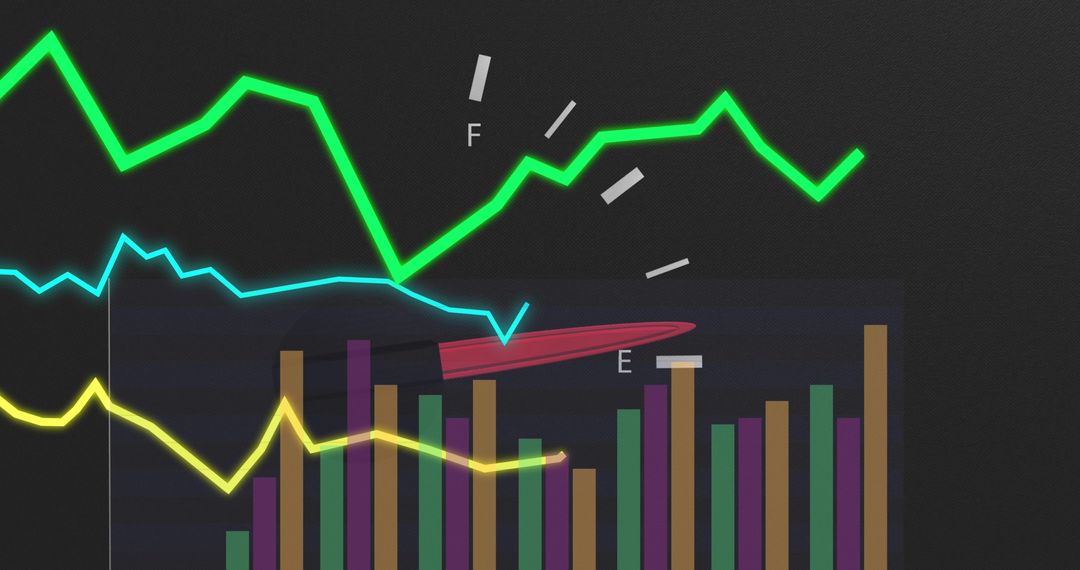
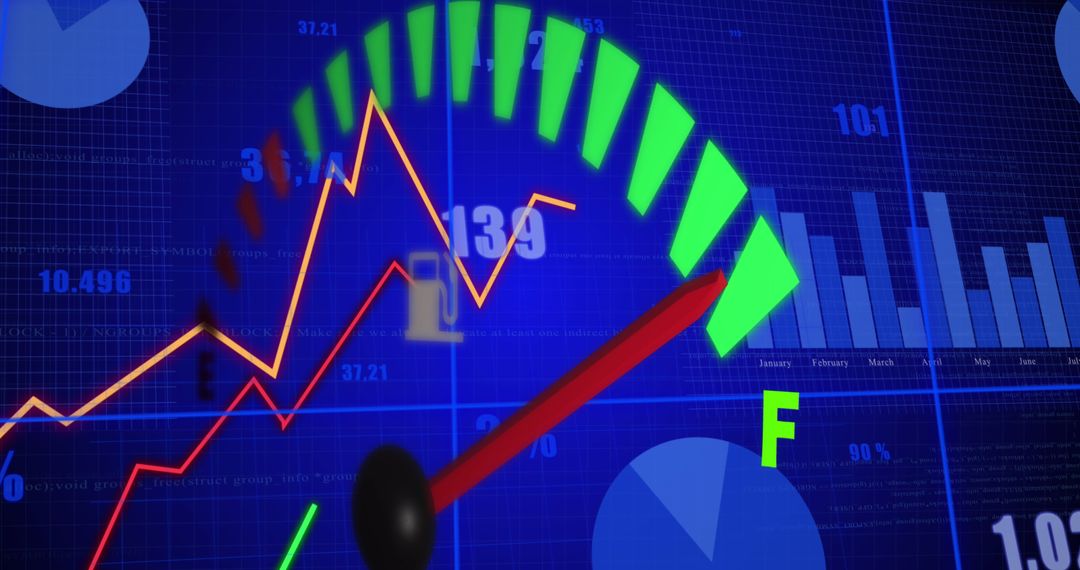
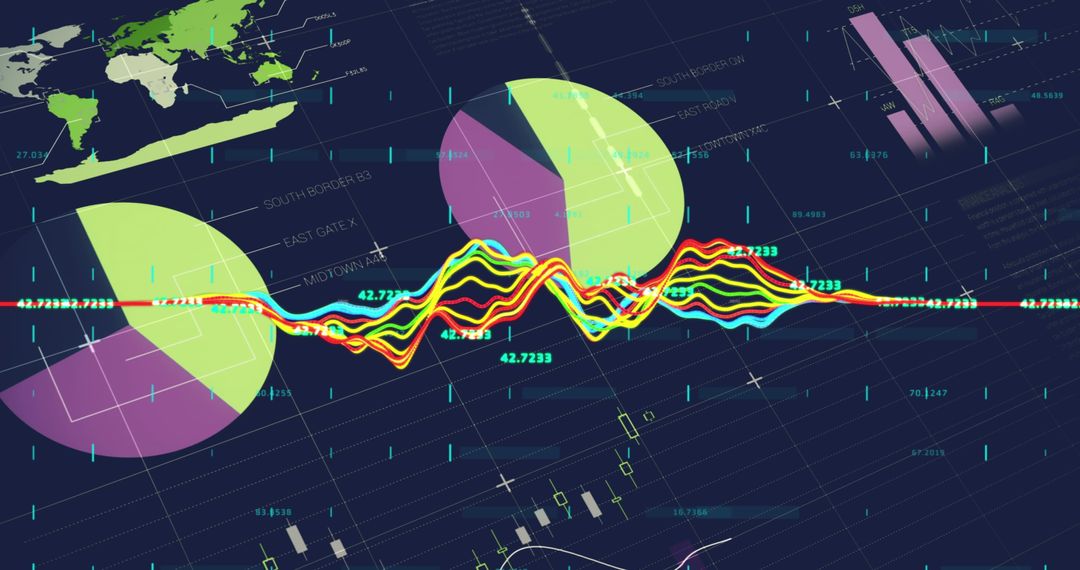
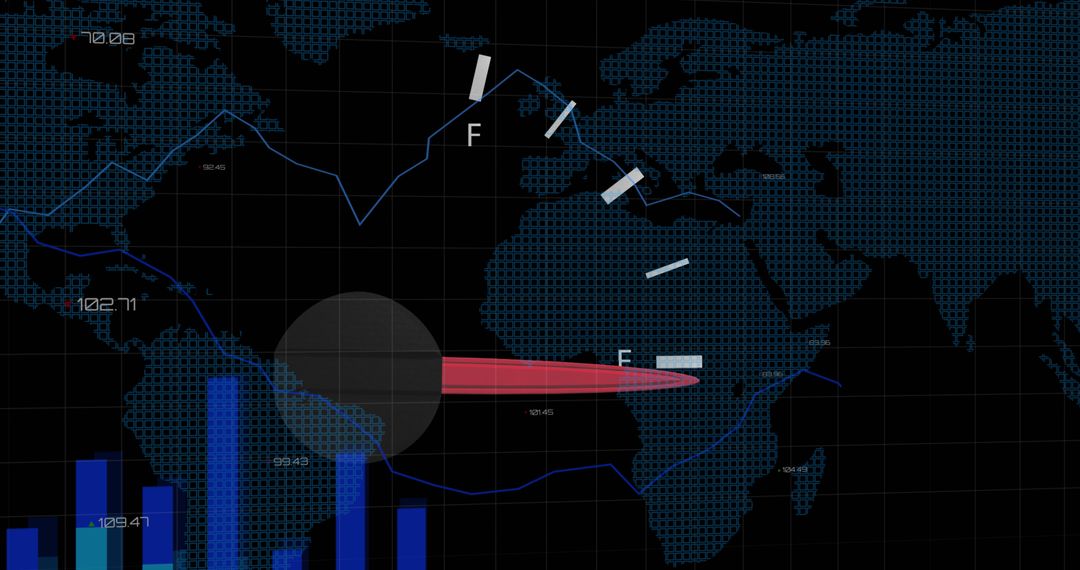
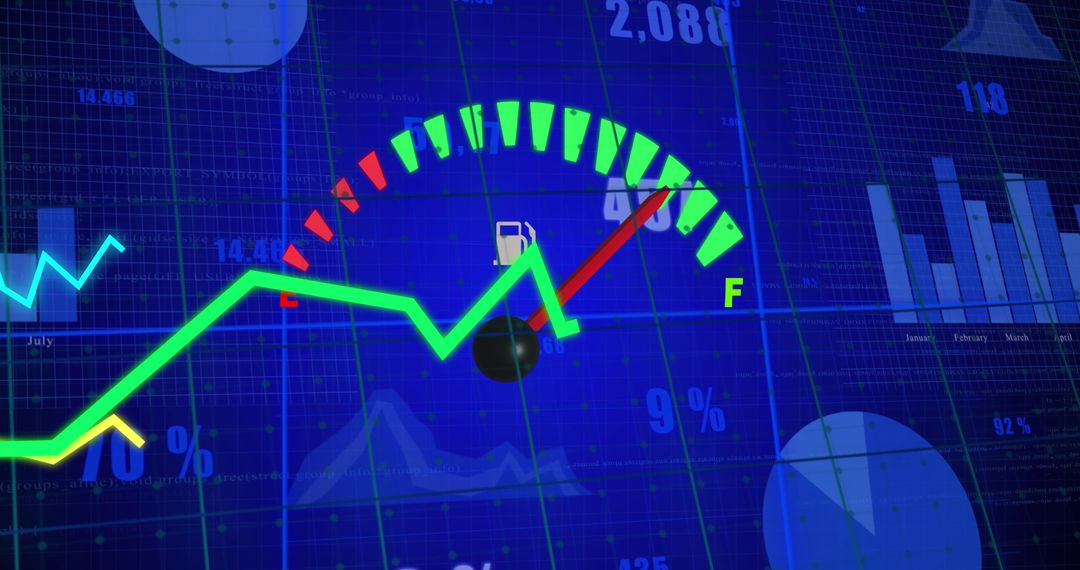
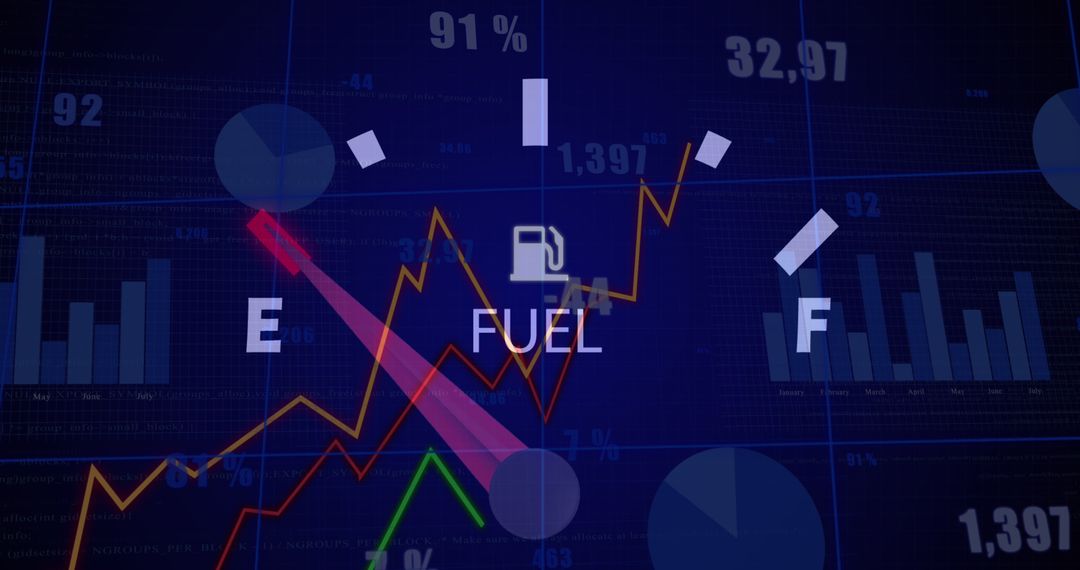
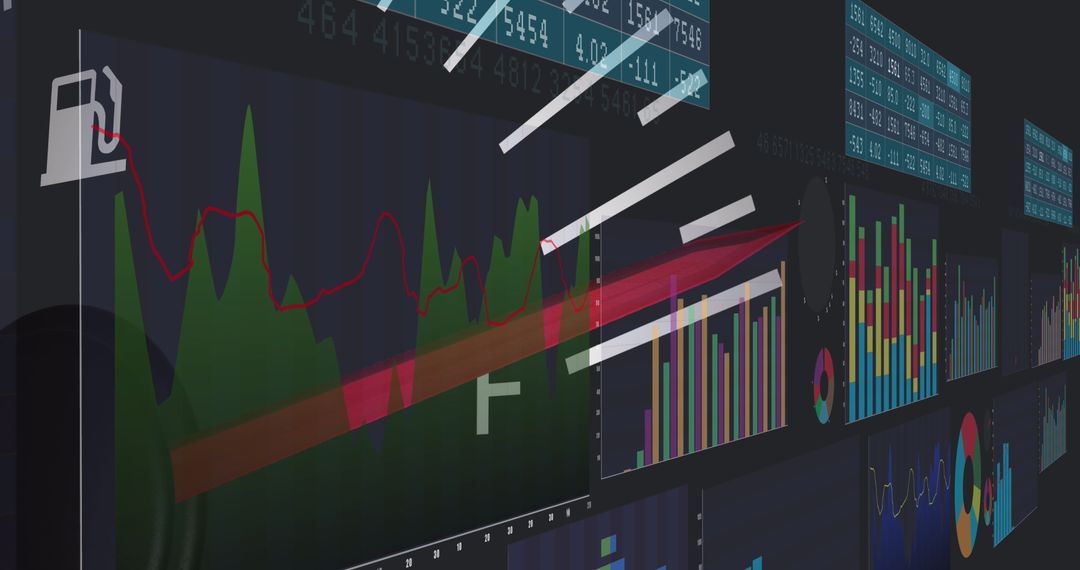
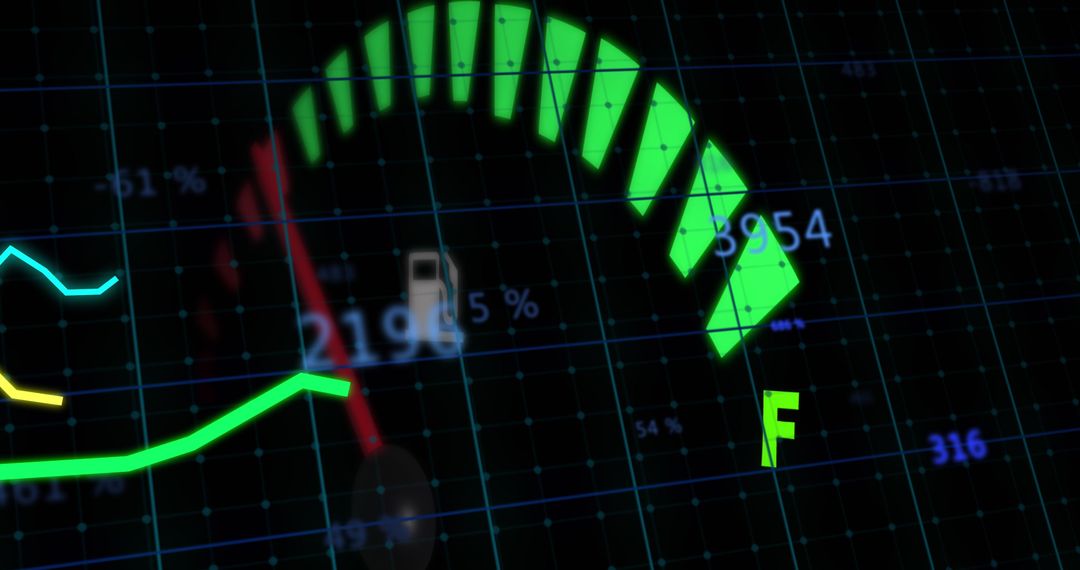
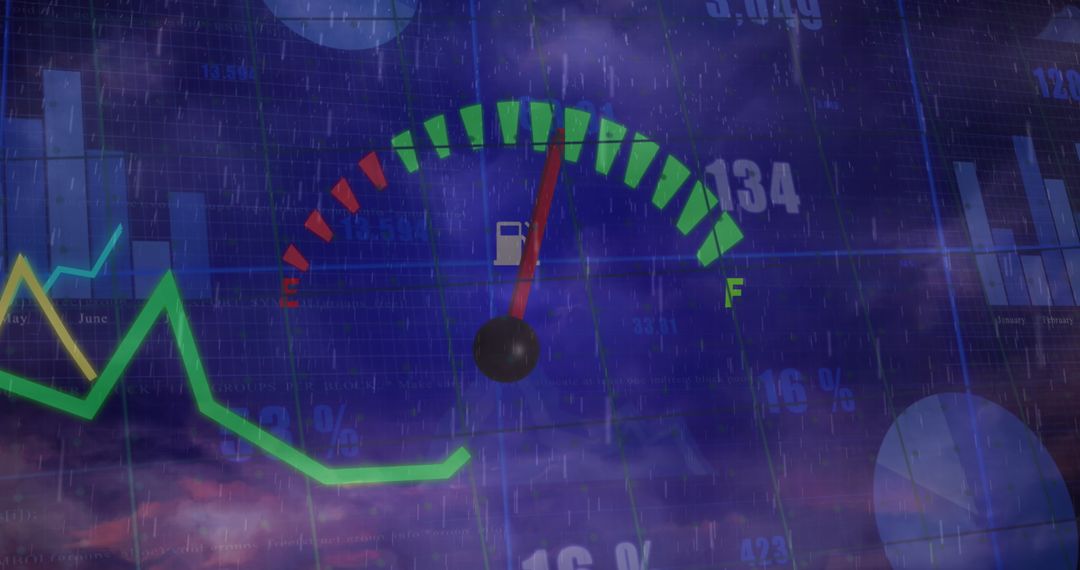
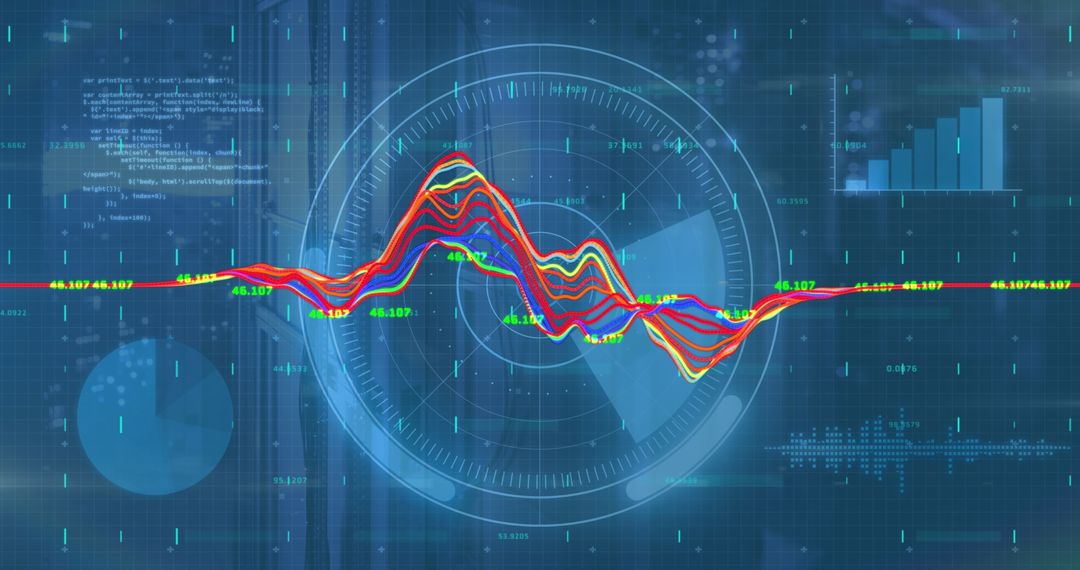
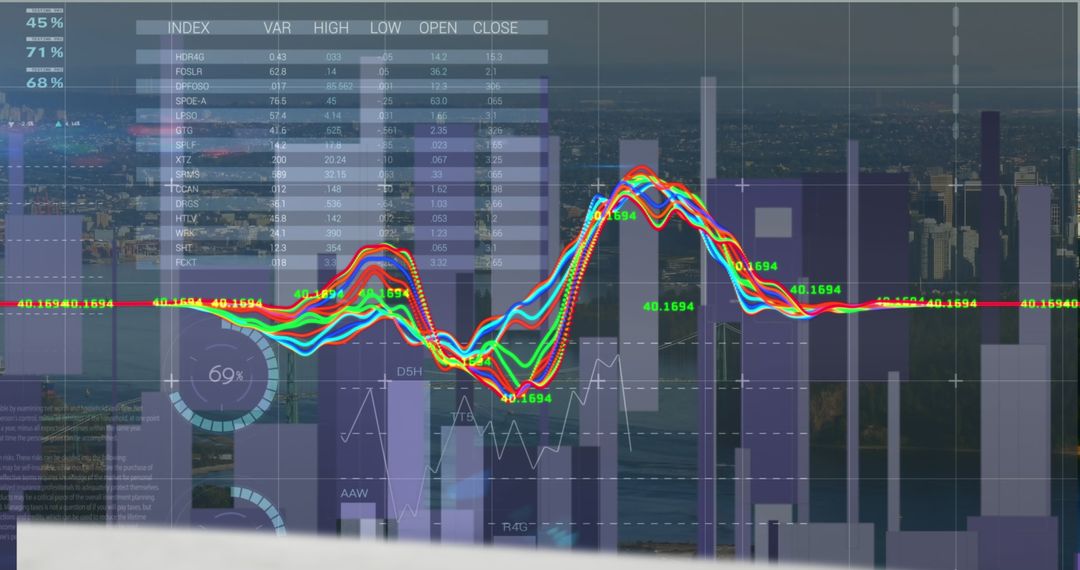
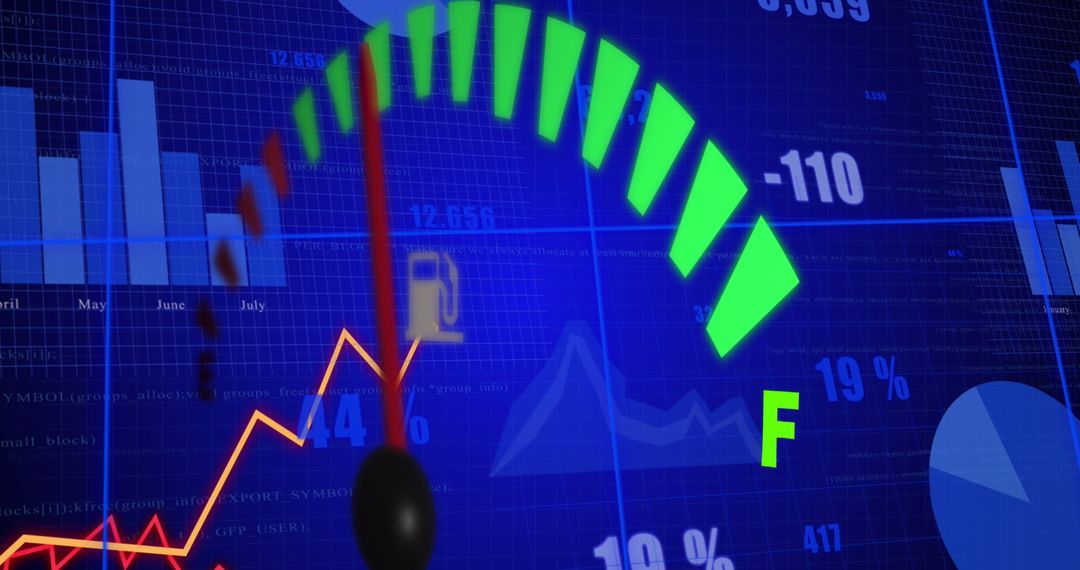
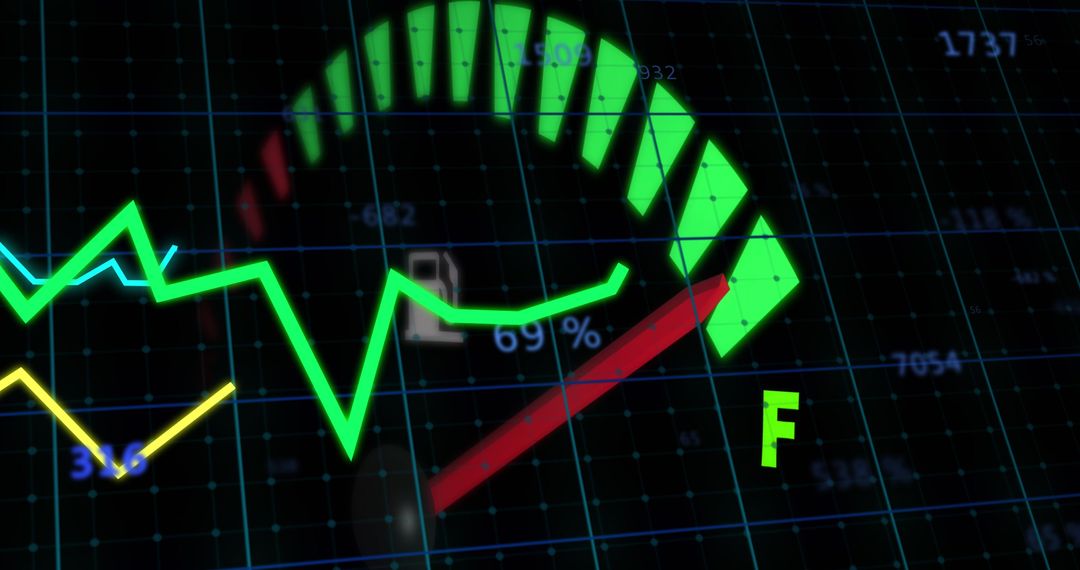
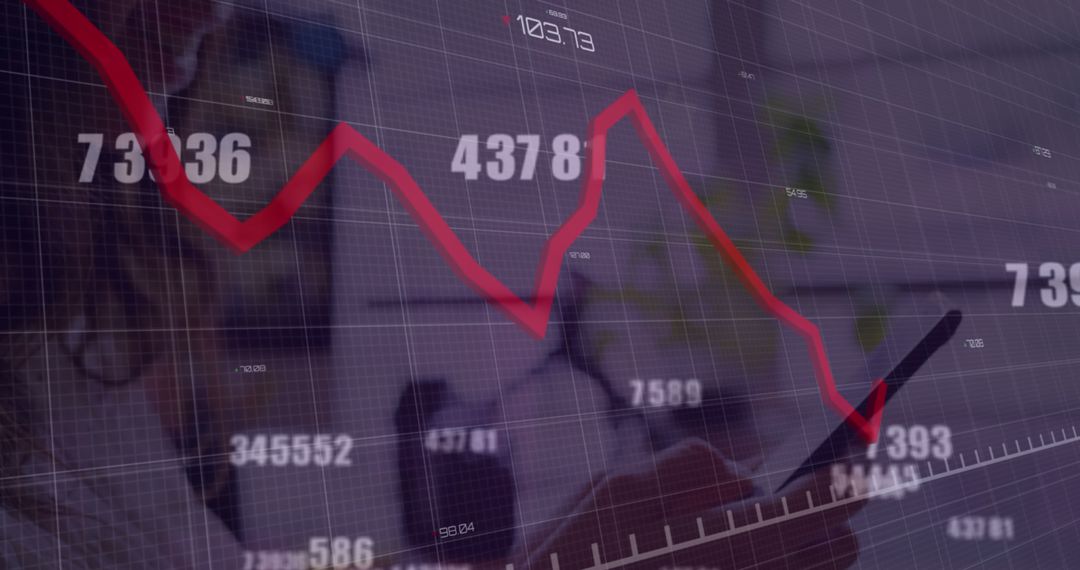
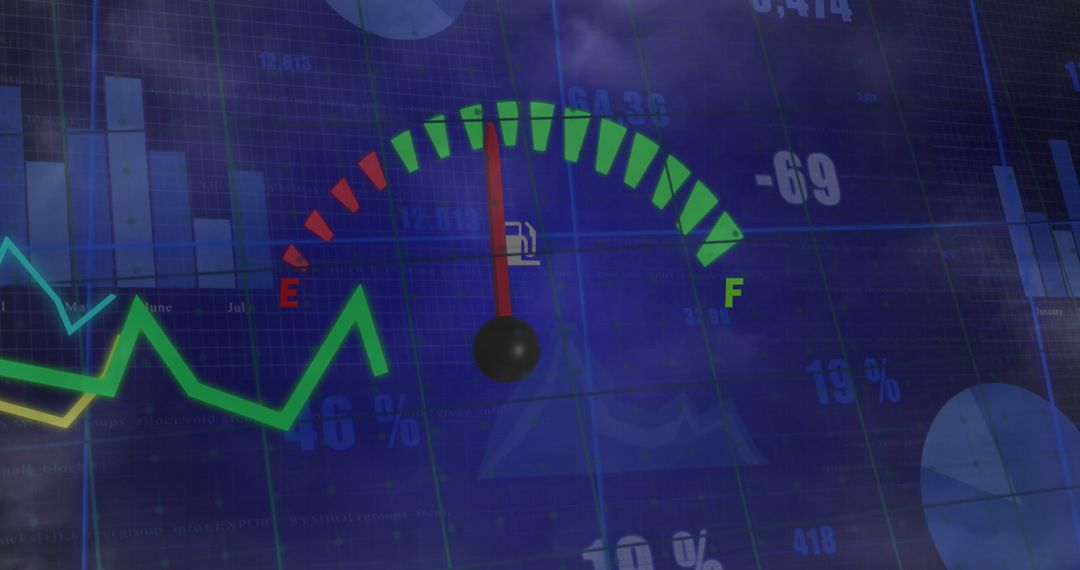
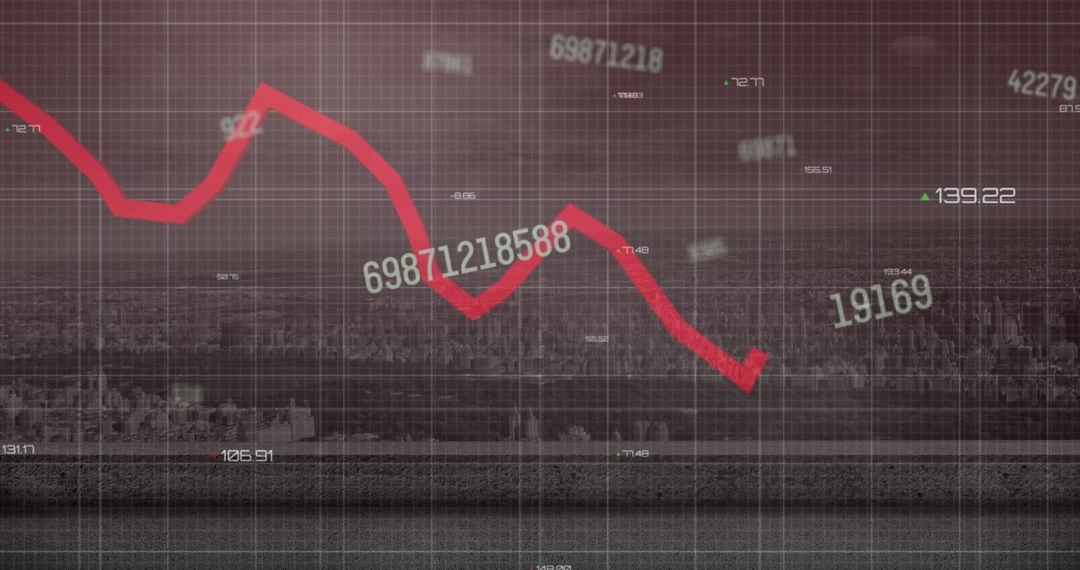
- Dynamic Financial Trends with Car Speedometer Overlay
Dynamic Financial Trends with Car Speedometer Overlay Image
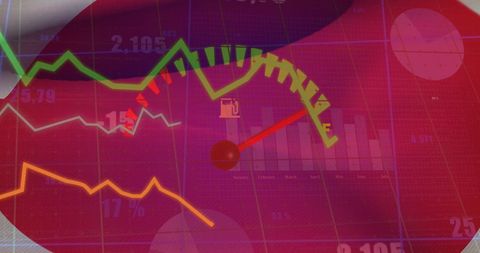
Dynamic depiction of financial charts intertwined with a car speedometer graphic, symbolizing acceleration and trends in financial markets. Ideal for use in presentations, articles, or content related to interactive data processing, economic forecasting, or advancements in financial or technological fields.

2
downloads
downloads
Tags:
More
Credit Photo
If you would like to credit the Photo, here are some ways you can do so
Text Link
photo Link
<span class="text-link">
<span>
<a target="_blank" href=https://pikwizard.com/photo/dynamic-financial-trends-with-car-speedometer-overlay/1fa8b3d7014c815bd34d3cf1c67fd85c/>PikWizard</a>
</span>
</span>
<span class="image-link">
<span
style="margin: 0 0 20px 0; display: inline-block; vertical-align: middle; width: 100%;"
>
<a
target="_blank"
href="https://pikwizard.com/photo/dynamic-financial-trends-with-car-speedometer-overlay/1fa8b3d7014c815bd34d3cf1c67fd85c/"
style="text-decoration: none; font-size: 10px; margin: 0;"
>
<img src="https://pikwizard.com/pw/medium/1fa8b3d7014c815bd34d3cf1c67fd85c.jpg" style="margin: 0; width: 100%;" alt="" />
<p style="font-size: 12px; margin: 0;">PikWizard</p>
</a>
</span>
</span>
Free (free of charge)
Free for personal and commercial use.
Author: Creative Art
Similar Free Stock Images