
- Home >
- Stock Photos >
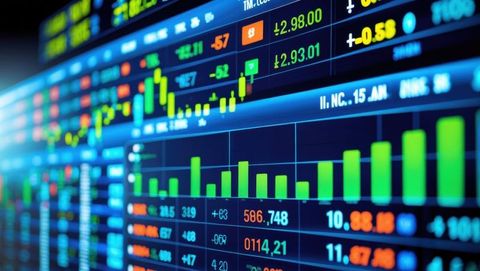
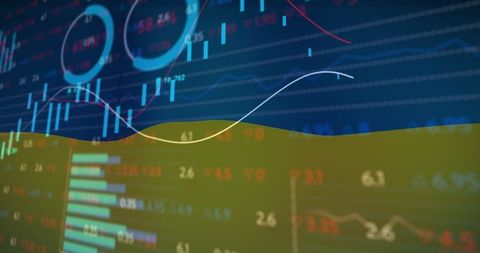
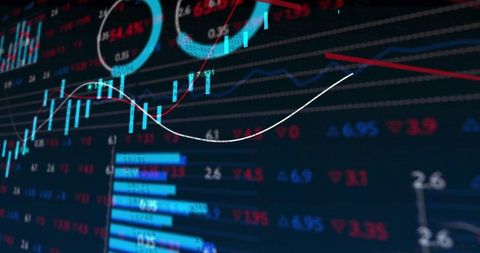
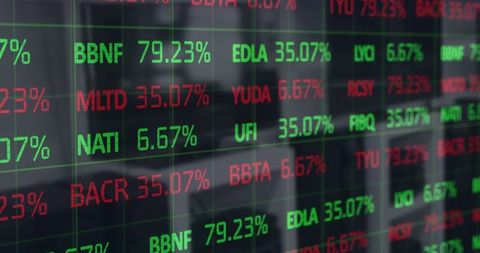
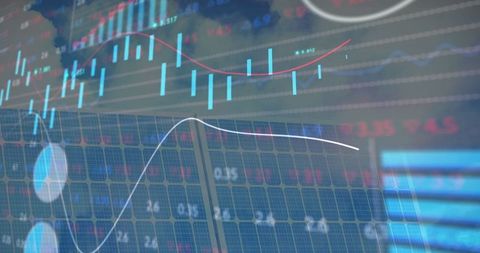
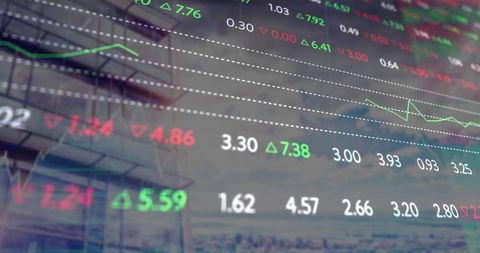
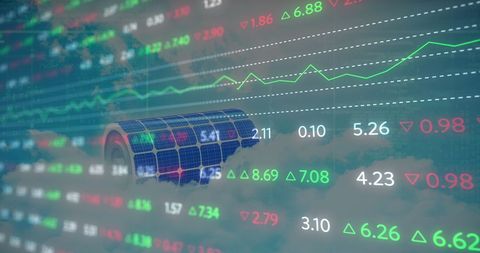
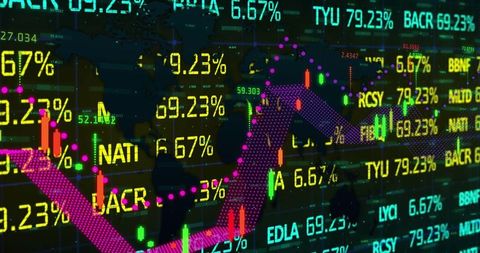
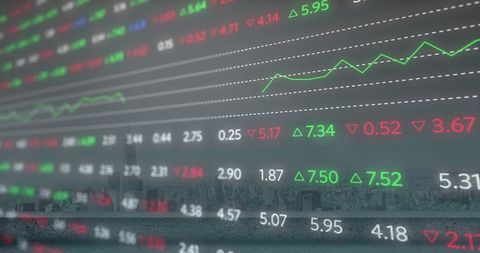
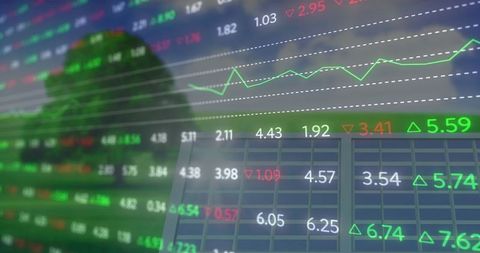
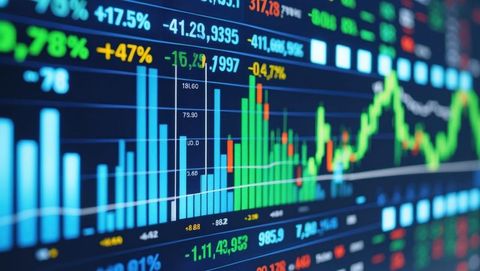
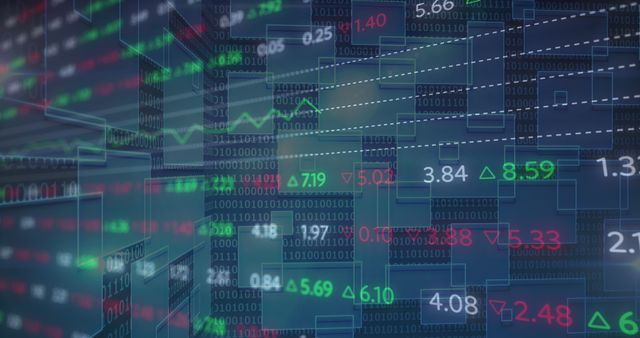
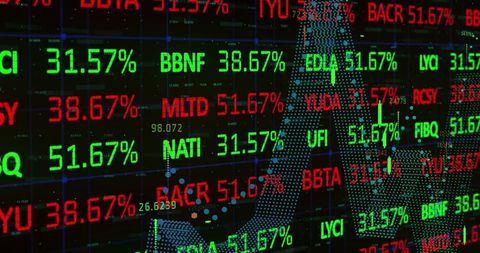
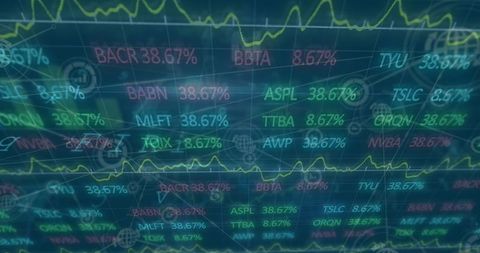
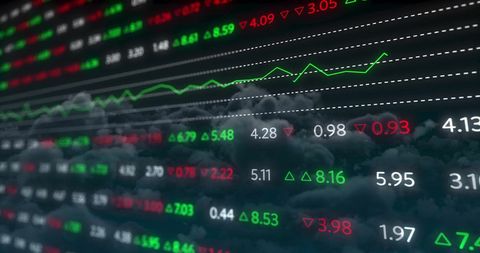
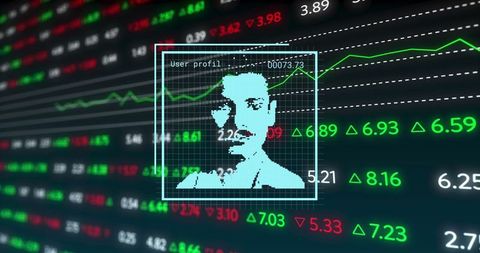
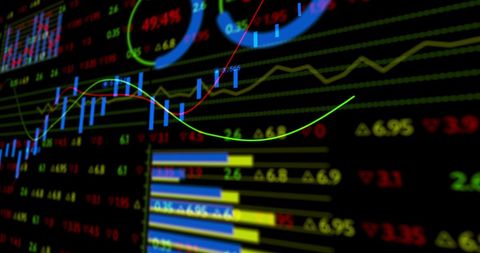
- Dynamic Financial Visualization with Digital Trading Data Displays
Dynamic Financial Visualization with Digital Trading Data Displays Image
AI
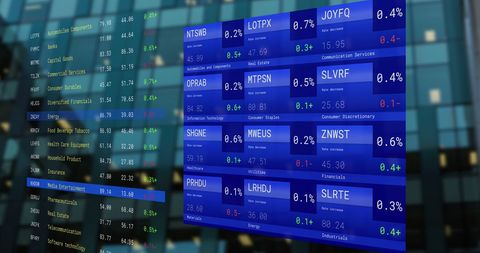
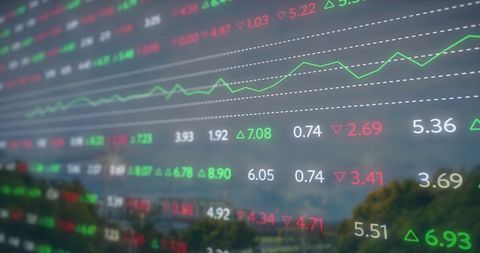
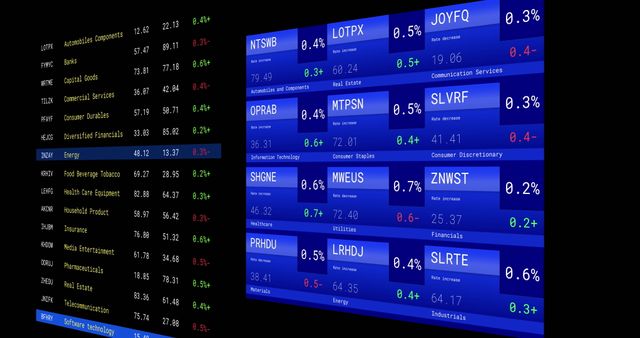
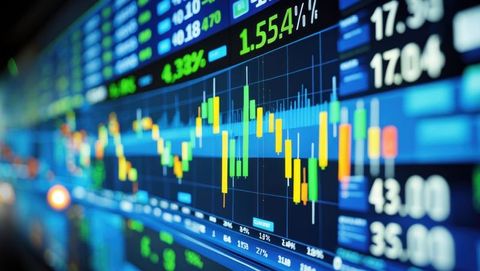
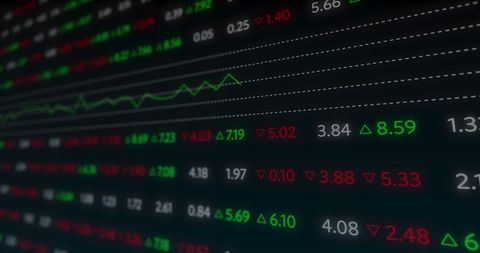
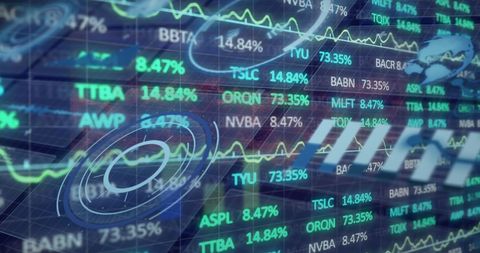
AI Generated Image. This image showcases a dynamic display of financial data including a candlestick chart and bar charts on a trading desk setup with tickers offering price quotes. It is ideal for illustrating concepts of financial technology, data-driven market analysis, or digital trading tools. Perfect for articles and presentations related to investment strategies, fintech innovations, and stock market education.

downloads
Tags:
More
Credit Photo
If you would like to credit the Photo, here are some ways you can do so
Text Link
photo Link
<span class="text-link">
<span>
<a target="_blank" href=https://pikwizard.com/photo/dynamic-financial-visualization-with-digital-trading-data-displays/6290d5d995194401a307a22ce6d246de/>PikWizard</a>
</span>
</span>
<span class="image-link">
<span
style="margin: 0 0 20px 0; display: inline-block; vertical-align: middle; width: 100%;"
>
<a
target="_blank"
href="https://pikwizard.com/photo/dynamic-financial-visualization-with-digital-trading-data-displays/6290d5d995194401a307a22ce6d246de/"
style="text-decoration: none; font-size: 10px; margin: 0;"
>
<img src="https://pikwizard.com/pw/medium/6290d5d995194401a307a22ce6d246de.jpg" style="margin: 0; width: 100%;" alt="" />
<p style="font-size: 12px; margin: 0;">PikWizard</p>
</a>
</span>
</span>
Free (free of charge)
Free for personal and commercial use.
Author: AI Creator
Similar Free Stock Images
AI


AI
AI


AI


AI


AI
AI
AI

AI


AI
Explore More Free Stock Images