- Home >
- Stock Photos >
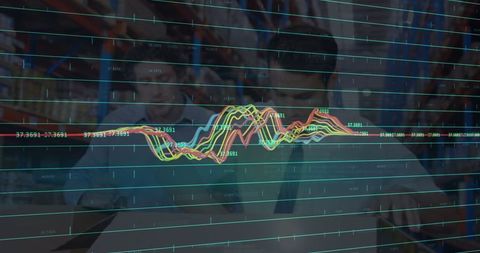
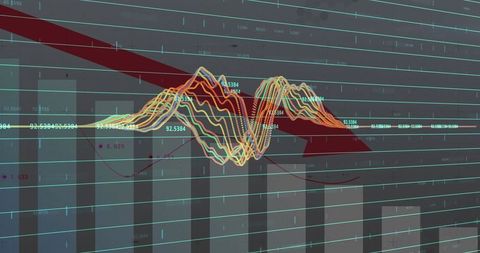
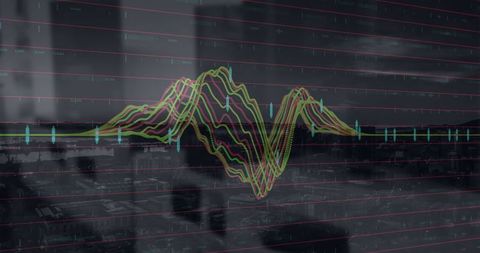
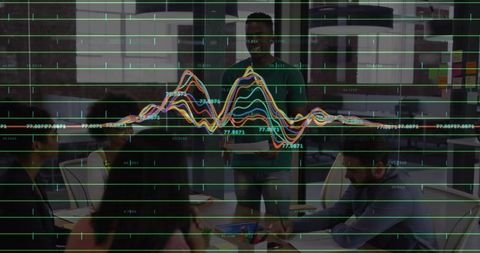
- Dynamic Financial Waveform with Data Visualization Elements
Dynamic Financial Waveform with Data Visualization Elements Image
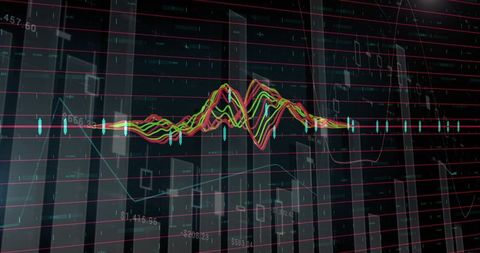
Concept illustrates pulse of economic movements and analyses, perfect for financial platforms demonstrating dynamic market tracking and dashboards. Shows complex stock exchanges and analysis for presentations, educational materials, or technological device interfaces dealing with market proximity and tracking evolution.

downloads
Tags:
More
Credit Photo
If you would like to credit the Photo, here are some ways you can do so
Text Link
photo Link
<span class="text-link">
<span>
<a target="_blank" href=https://pikwizard.com/photo/dynamic-financial-waveform-with-data-visualization-elements/7aba594f1ff3a3607c64b327f965b5f8/>PikWizard</a>
</span>
</span>
<span class="image-link">
<span
style="margin: 0 0 20px 0; display: inline-block; vertical-align: middle; width: 100%;"
>
<a
target="_blank"
href="https://pikwizard.com/photo/dynamic-financial-waveform-with-data-visualization-elements/7aba594f1ff3a3607c64b327f965b5f8/"
style="text-decoration: none; font-size: 10px; margin: 0;"
>
<img src="https://pikwizard.com/pw/medium/7aba594f1ff3a3607c64b327f965b5f8.jpg" style="margin: 0; width: 100%;" alt="" />
<p style="font-size: 12px; margin: 0;">PikWizard</p>
</a>
</span>
</span>
Free (free of charge)
Free for personal and commercial use.
Author: Authentic Images