- Home >
- Stock Photos >
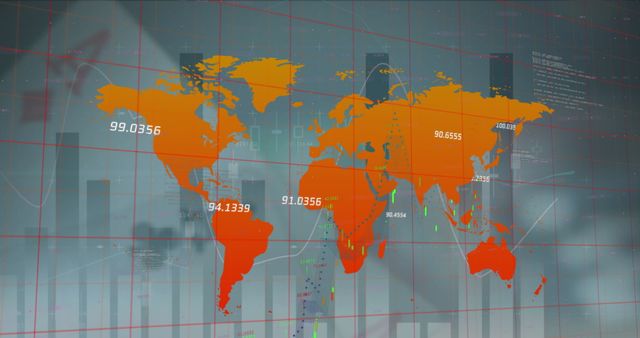
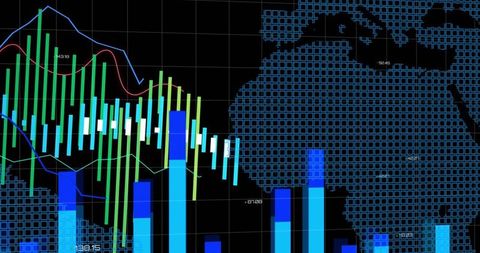
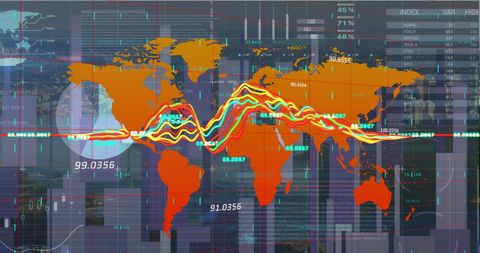
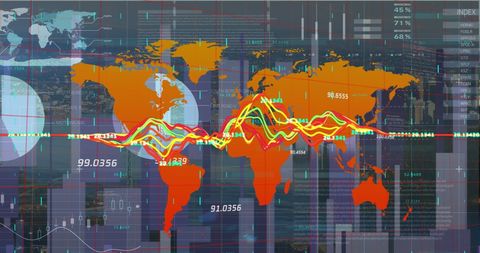
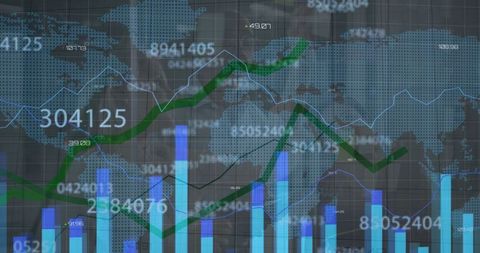
- Dynamic Global Finance and Statistics Visualization with World Map
Dynamic Global Finance and Statistics Visualization with World Map Image

Concept illustrates international financial trends and economic data. Useful for presentations, educational materials, and content related to global investment strategies and market analysis. Highlights importance of data-driven insights and analytics in understanding economic patterns.

downloads
Tags:
More
Credit Photo
If you would like to credit the Photo, here are some ways you can do so
Text Link
photo Link
<span class="text-link">
<span>
<a target="_blank" href=https://pikwizard.com/photo/dynamic-global-finance-and-statistics-visualization-with-world-map/886bce9cb9cb9bb40cc7b5faf7f2344b/>PikWizard</a>
</span>
</span>
<span class="image-link">
<span
style="margin: 0 0 20px 0; display: inline-block; vertical-align: middle; width: 100%;"
>
<a
target="_blank"
href="https://pikwizard.com/photo/dynamic-global-finance-and-statistics-visualization-with-world-map/886bce9cb9cb9bb40cc7b5faf7f2344b/"
style="text-decoration: none; font-size: 10px; margin: 0;"
>
<img src="https://pikwizard.com/pw/medium/886bce9cb9cb9bb40cc7b5faf7f2344b.jpg" style="margin: 0; width: 100%;" alt="" />
<p style="font-size: 12px; margin: 0;">PikWizard</p>
</a>
</span>
</span>
Free (free of charge)
Free for personal and commercial use.
Author: Authentic Images