
- Home >
- Stock Photos >
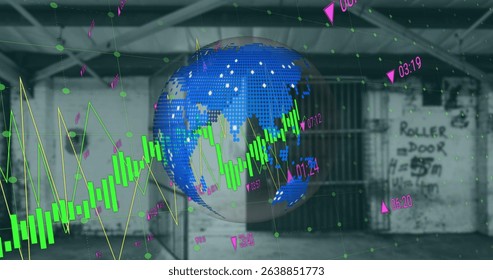
- Dynamic Global Financial Data and Analytics Interface
Dynamic Global Financial Data and Analytics Interface Image

Depicts a vibrant mix of red graphs and global analytics, indicating shifting economic metrics. Perfect for illustrating articles about global finance trends, stock market fluctuations, or economic reporting. Can be used in business presentations to discuss multinational economic impacts and in digital projects focused on financial analytics and forecasting.
Powered by  - Get 15% off with code: PIKWIZARD15


downloads
Tags:
More
Credit Photo
If you would like to credit the Photo, here are some ways you can do so
Text Link
photo Link
<span class="text-link">
<span>
<a target="_blank" href=https://pikwizard.com/photo/dynamic-global-financial-data-and-analytics-interface/c9230bc17415e7a2e15902b6366a07b5/>PikWizard</a>
</span>
</span>
<span class="image-link">
<span
style="margin: 0 0 20px 0; display: inline-block; vertical-align: middle; width: 100%;"
>
<a
target="_blank"
href="https://pikwizard.com/photo/dynamic-global-financial-data-and-analytics-interface/c9230bc17415e7a2e15902b6366a07b5/"
style="text-decoration: none; font-size: 10px; margin: 0;"
>
<img src="https://pikwizard.com/pw/medium/c9230bc17415e7a2e15902b6366a07b5.jpg" style="margin: 0; width: 100%;" alt="" />
<p style="font-size: 12px; margin: 0;">PikWizard</p>
</a>
</span>
</span>
Free (free of charge)
Free for personal and commercial use.
Author: Authentic Images
Similar Free Stock Images

Premium


Premium


Premium


Premium


Premium


Premium


Premium


Premium


Premium


Premium


Premium


Premium


Premium

Premium

Premium


Premium


Premium


Premium

Premium


Premium


Premium


Premium


Premium

Premium


Premium


Explore More Free Stock Images