
- Home >
- Stock Photos >
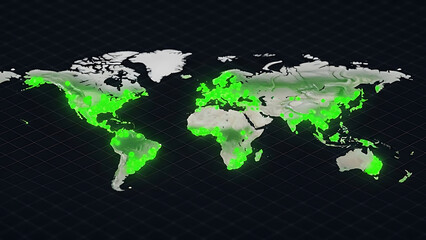
- Dynamic Global Financial Data Display with World Map
Dynamic Global Financial Data Display with World Map Image

Visualization shows interactive display of financial data on digital grid overlaid on world map. Vibrant lines depict fluctuating economic trends across continents. Ideal for depicting technology advancement, financial analytics, international economic activities, and global business insights in presentations, reports, and articles.
Powered by 


downloads
Tags:
More
Credit Photo
If you would like to credit the Photo, here are some ways you can do so
Text Link
photo Link
<span class="text-link">
<span>
<a target="_blank" href=https://pikwizard.com/photo/dynamic-global-financial-data-display-with-world-map/4a3ffda714a0ba5cec0c56c113de5f2b/>PikWizard</a>
</span>
</span>
<span class="image-link">
<span
style="margin: 0 0 20px 0; display: inline-block; vertical-align: middle; width: 100%;"
>
<a
target="_blank"
href="https://pikwizard.com/photo/dynamic-global-financial-data-display-with-world-map/4a3ffda714a0ba5cec0c56c113de5f2b/"
style="text-decoration: none; font-size: 10px; margin: 0;"
>
<img src="https://pikwizard.com/pw/medium/4a3ffda714a0ba5cec0c56c113de5f2b.jpg" style="margin: 0; width: 100%;" alt="" />
<p style="font-size: 12px; margin: 0;">PikWizard</p>
</a>
</span>
</span>
Free (free of charge)
Free for personal and commercial use.
Author: Creative Art
Similar Free Stock Images

Premium


Premium

Premium


Premium


Premium


Premium


Premium


Premium


Premium


Premium


Premium


Premium


Premium


Premium


Premium


Premium

Premium


Premium


Premium


Premium


Premium


Premium


Premium


Premium


Premium


Explore More Free Stock Images