1. Home > 
  2. Stock Photos > 
  3. Dynamic Global Market Trends Over World Map Visualization

Dynamic Global Market Trends Over World Map Visualization Image

Dynamic Global Market Trends Over World Map Visualization

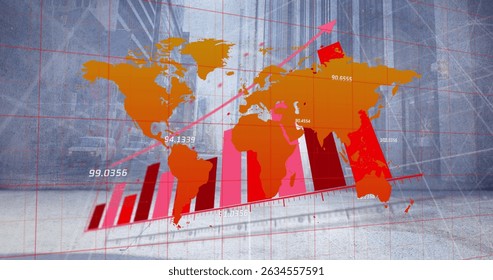
Image showcases dynamic graph overlaying world map, illustrating global financial markets and analyzing economic data. Useful for topics related to international business, economic analysis, and digital data monitoring. Ideal for presentations on global market trends, stock exchange analysis, financial forecasts, and economic strategies.

Powered by Adobe logo
A futuristic office environment showcasing a holographic display with global data visualizations. - Powered by AdobeImage of data processing and networks of connections over world map - Powered by AdobeA futuristic hand presents a dynamic data visualization featuring a rising graph against a global map background, symbolizing growth in finance and business innovation. Copula - Powered by AdobeGlobal digital network with interconnected data streams visualized in stunning abstract world map concept, perfect for tech and business use - Powered by AdobeDigital world map with connections representing joint venture deal negotiation process - Powered by Adobe

Credit Photo

If you would like to credit the Photo, here are some ways you can do so

Free (free of charge)

Free for personal and commercial use.

Author: Creative Art

Similar Free Stock Images

Loading...
Financial Data Displayed Over City Skyline with Rising Graphs
Premium
Pharmacology, profit from sales. Hand holding a red pill with rising arrows and a world map, highlighting the booming global sales of a groundbreaking medication Minimalist art collage.
Digital Financial Data Overlaying City Skyline at Dusk
Futuristic Digital Data Analytics Interface Display
Surprising Drop in Digital Stock Market Chart Visualization
Rising Financial Market Trends with Data Visualization
Premium
Person types on keyboard analyzing big data and business analytics displayed on a screen, showing World map and graphics near a wooden table
Premium
Global data links connecting retail science across a digital world map with glowing location pins and network lines.
Cityscape with Financial Data Overlay and Digital Graphics
Dynamic Financial Growth Representing Business Trends
Abstract Neon Waves on Dark Background Concept
Financial Growth Chart Overlay on City Skyline
Premium
Customer Relationship Management, HR solution, and global teamwork technology for corporate communication and management. Business concept with digital human icons connected on world map network.
Futuristic Graph with Digital Globe Symbolizing Global Technology Connections
Dynamic Stagflation Concept Displaying Economic Burdens
Digital Representation of Slumpflation in Global Economy
Premium
Abstract Financial Data Visualization With Colorful Geometric Lines And Shapes
Financial Data Analysis with Declining Trends
Dynamic Financial Data Visualizations on Grid Interface
Dynamic Colorful Waves on Black Digital Background
Dynamic Green Stock Market Chart with Upward Arrows
Premium
A business professional engages with advanced data visualizations and a world map on a laptop, highlighting the intersection of technology and business analytics. Impute
Global Networking Concept with 6G Technology Display
Financial Data Processing with Green Digital Graph in Action
Upward Stock Market Arrow with Binary Code Background
Dynamic Stock Market Graph with ECO Icons
Premium
Global financial data analysis with world map and currency coins on display, financial data processing and clock over world map
Premium
Oil industry equipment operates with digital data overlays on a world map background, symbolizing global energy trends and market analysis
Futuristic Data Dashboard with Abstract Waveforms and Light Effects
Overlay of Line Graph Trends on Busy Highway Scene
Neon Blue ECG Waveform on Futuristic Digital Grid Background
Financial Data Visualization Over Futuristic Cityscape
Graph Lines Portraying Financial Data Trends
Premium
double exposure of advanced technology like servers and data centers overlaid with global finance symbols like currency exchange rates and world maps
Dynamic Growth Chart with Rising Arrows in Green Tones
Declining Stock Market Graph on Digital Background
Dynamic Green Stock Chart on Digital Grid Background
Financial Chart Indicating Economic Inflation Trends
Abstract Financial Data Visualization in Server Room
Premium
Global Data Analysis Interactive World Map Visualization and Business Intelligence
Digital Data Overlay on Urban Skyline Examining Global Business Trends
Global Financial Markets Chart with Grid Overlay
Futuristic Stock Market Graph With Digital Overlay
Dynamic Stock Market Graph Displaying Surging Growth
Premium
World map with e-commerce infographics. Concept of global online business.
Economic Turmoil Highlighted by Slumpflation Conceptual Graph
Futuristic Digital Interface with Dynamic Financial Graph
Analyzing Stock Market Trends with Dynamic Graphs and Data
Analytics Graph Overlay on Modern Data Center
Premium
Businessman looks at strategy infographics world map on the wall. Man studying diagrams, data charts. Pro decision making process. Business problem solving. Strategic planning. Business intelligence.
Dynamic Financial Stock Market Graph
Financial Growth Data Overlay on Urban Skyline
Abstract Financial Market Trends with Urban Lights
Glowing Financial Graph of Stock Market Trends on Digital Screen
Premium
Streamline your logistics with modern supply chain management solutions and reach global markets with seamless delivery, unlocking new business opportunities and growth
Financial Data Analytics with Dynamic Green Arrows
Financial Stock Market Data Visualization with Declining Trends
Dynamic Financial Data Analysis with Graph Overlays
Colorful Waveforms on Blue Background
Premium
Futuristic Global Data Visualization with Luminous World Map.
Futuristic Digital Finance Chart With Green Data Visualization
Pulsing Orange Waveform Intersecting C++ Code and Math with Neon Magenta Glow
Financial Data Analysis with Global Digital Interface
Abstract Digital Financial Chart on Blue Background
Digital World Map with Dynamic Financial Analysis Overlay
Rising Market Trends Green Arrow Chart with Numbers
Declining Stock Market Graph on Dotted Grid Background
Dynamic Financial Stock Market Data Analysis
Stagflation Concept with Financial Data and Digital Interface
Digital Stock Data Overlay in Modern Server Room
Global Economy Displaying Growth Trends with Ukraine-NATO Financial Outlook
Futuristic Stock Market Data Visualization with Graphs
Abstract Financial Chart Over Modern Cityscape
Premium
Person using tablet with world map overlay, representing global logistics and distribution within a warehouse setting.
Cityscape with Stock Market Digital Interface Overlay
Dynamic Data Graphs on Digital Interface Background
Stagflation Concept with Red Graph Overlay on Cityscape
Stagflation Headlines with Digital World Map and Graph
Digital Financial Data Graph Showcasing Market Trends
Premium
 Software systems for connecting to big data networks can process and analyze graph growth efficiently and accurately. Global social media systems, access to insights for research and business.
Abstract Stock Market Data with Growing Graph
Rising Financial Data Graph on Digital Grid Background
Digital Financial Analysis with Glowing Green Charts
Dynamic Stock Market Visual in Modern Office Setting
Premium
Abstract digital representation of global data, highlighting a fluctuating financial trend with a 3D Earth in the background
Digital Stock Market Display with Data Analysis Graphics
Binary Code Data Over Financial Graph with Red Trends
Financial Data with Molecular Background Concept
Dynamic Stock Market Chart with Fluctuating Trends and Data Points
Global Financial Data Analysis with Green Growth Arrows on Blue Background
Digital Security In Financial Analytics Showing Data Chart and Padlock
Dynamic Line and Bar Graph on Digital Screen
Futuristic Financial Data Analytics with Particle Visualization
Premium
A hand interacts with a digital world map displaying business locations and connections
Line Graphs on Digital Background Show Financial Data Trends
Financial Data Overlay on Cityscape Visualizing Market Trends
Financial Data with World Map and Digital Waves
Premium
Professional executive touches digital interface of business strategy icons for global market success and innovation
Premium
glowing white arrow showing upward trend on a world map background for business and economic growth concept
Digital Financial Data Visualization with Graph and Metrics
Dynamic Inflation Rate Visualization with Code Overlay
Digital Financial Data on Server with Stock Market Graph
Financial Data Visualizations Expert Economic Impact on Urban Skyline
Premium
global Network Nodes Connection Close up of a circuit board with glowing nodes and data pathways, representing digital technology, information processing, and global data transfer.
Global Data Analytics on Digital Grid Interface
Dynamic Stock Market Data on Digital Interface
Digital Interface with Global Business Data Analytics
Digital Concept of Stagflation with Chart and Globe Illustration
Premium
Marketing target audience and sales strategy concept, digital illustration of customer targeting with business icons on global network and world map background
European Market Data Overlay with EU Flag and Financial Graphs
Dynamic Stock Market Graphs Over Digital Interface
Dynamic Stock Market Graph with Green Arrows and Numbers
Futuristic Global Finance Chart with Rotating Globe Animation
Premium
Displaying multicolored candlestick and dotted trend charts on trading dashboard, with world map
Data Analytics and Business Strategy Network Interface
Financial Growth Curve Over City Skyline Displaying Business Trends
Dynamic Financial Chart with Upward Growth Arrow
Dynamic Financial Graphs Overlaying Urban Skyline
Premium
Illustration of a finger presses a glowing it consulting button on a futuristic interface with a world map in the background, symbolizing modern business solutions
Dynamic Financial Data Displays Stock Market Trends
Digital Stock Market Graph Red Trendline on Green Background
Dynamic Financial Data Visualization with Abstract Graph
Financial Growth Chart Over Ocean with Green Grid Overlay
Premium
Global data visualization
Glowing Neon Red Global Trend Line Chart Showing Market Fluctuations on Digital World Map