1. Home > 
  2. Stock Photos > 
  3. Dynamic Glowing Digital Graphs on 3D Grid Background

Dynamic Glowing Digital Graphs on 3D Grid Background Image

Dynamic Glowing Digital Graphs on 3D Grid Background

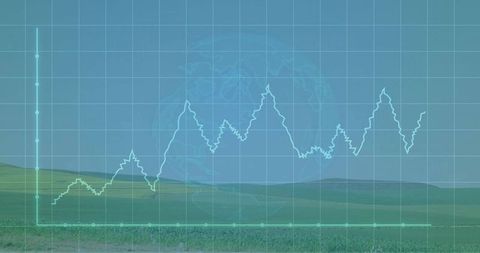
This visual conveys themes of technological innovation, global communication, and business analytics with vibrant, glowing lines representing data movement on a 3D grid. Perfect for use in presentations, websites, or publications related to global business operations, fintech, data analysis, and cutting-edge technology solutions. Ideal for illustrating concepts of future financial trends or the digital web landscape.

Powered by Shutterstock logo - Get 15% off with code: PIKWIZARD15
display of a digital data grid in blue tones - Powered by Shutterstock - Get 15% off with code: PIKWIZARD15Rotating 3D Earth globe showing data charts, grid overlay and numeric labels in analytics hub. Technology, visualization, analytics, data, network, digital, science - Powered by Shutterstock - Get 15% off with code: PIKWIZARD15display of a digital data grid in blue tones - Powered by Shutterstock - Get 15% off with code: PIKWIZARD15Image of blue graph and data processing over 3d grid. Global communication, business, finance and data interface concept digitally generated image. - Powered by Shutterstock - Get 15% off with code: PIKWIZARD15Rotating 3D Earth globe showing pie chart segment on cosmic digital dashboard, with line graphs. Futuristic, data visualization, digital interface, technology, analytics, space-inspired, holographic - Powered by Shutterstock - Get 15% off with code: PIKWIZARD15

Credit Photo

If you would like to credit the Photo, here are some ways you can do so

Free (free of charge)

Free for personal and commercial use.

Author: Authentic Images

Similar Free Stock Images

Futuristic Data Dashboard with Graph and Code Overlay
Premium
display of a digital data grid in blue tones
Holographic analytics dashboard displaying neon line charts, nodes and red data rings
Premium
Spinning wireframe globe displaying nodes in digital dashboard, with pie charts and percent labels. Data analytics, futuristic, digital interface, visualization, technology, network, intelligence
Premium
Circular HUD 3D globe visualization rotating in dashboard, with airplane icon and bar charts. Data analysis, information technology, visualization, dashboard, digital, connectivity, futurism
Abstract Data Network with Financial Analytics Overlay
Interactive Digital Infographic with Callouts and Graph Elements
Data Analytics Graphs on Digital Interface Background
Analytics Graph Overlay on Modern Data Center
Premium
Displaying dotted 3D globe rotating in dashboard, with network lines, grid and floating data labels. Technology, data, visualization, analytics, digital, cyber, connectivity
Bitcoin Symbol with Financial Data Dynamic Representation
Futuristic 3D Finance Dashboard with Neon Waveform and Candlesticks
Abstract Financial Data Processing and Analysis Interface
Dynamic Inflation Rate Visualization with Code Overlay
Premium
Featuring white 3D bars rising in analytics dashboard with line graphs and lens flare, copy space. Data analytics, data visualization, futuristic, digital interface, technology, dashboard, information
City Skyline with Overlay of Financial Data Trends
Digital Financial Analysis on Futuristic Grid
Dynamic Financial Data Displays Stock Market Trends
Abstract Digital Graph and Code on Violet Background
Premium
Rotating 3D Earth globe streaming binary code and line bar charts in dashboard with map outlines. Globalization, technology, innovation, analytics, data visualization, futuristic, digital interface
Financial Data Visualization Over Futuristic Cityscape
Financial Data with Molecular Background Concept
Digital Interface with Human Portrait and Data Graphs
Dynamic Financial Graphs Overlaying Urban Skyline
Premium
Displaying red dotted trend line indicating downward trajectory on 3D grid axes, with blue globe. Data visualization, financial analytics, futuristic, digital, technology, trend analysis, control room
Abstract Visualization of Financial Data and Circuit Board
Glowing Financial Data Chart on Digital Grid Background
Rising Red Line Graph with Stock Market Candlesticks Overlay
Abstract Data Processing and Digital Analysis
Premium
computer-made digital lines in green tones, display of a digital data grid in green tones
Abstract Graphs Over Modern Building at Night
Dynamic Business Data and Cityscape Visualization
Dynamic Data Processing with Energy and Sustainability Icons
Digital Financial Data with Graph and Grid Patterns
Glowing Neon Red Global Trend Line Chart Showing Market Fluctuations on Digital World Map
Futuristic Digital Interface with Dynamic Financial Graph
Financial Growth Chart Over Ocean with Green Grid Overlay
Premium
Image of graphs processing data over 3d grid on black background. Global communication, business, finance and data interface concept digitally generated image.
Premium
Floating holographic panels displaying line graphs, bar charts, gauge dials over 3D triangular grid. Futuristic, technology, data, analytics, interface, visualization, digital
Dynamic Stock Market Visual in Modern Office Setting
Rising Financial Data Graph on Digital Grid Background
Dynamic Financial Data Graphs with Holographic Styles
Financial Data Overlay on Cityscape Visualizing Market Trends
Premium
Two 3D pie charts floating in analytics dashboard, with percentage labels and dotted trend line. Data visualization, dashboard, digital interface, future technology, information analysis, abstract
Abstract Data Visualization with Technological Grid Background
Abstract Financial Graph On Black Background Representing Data Analysis
Dynamic Data Graphs on Digital Interface Background
Financial Chart Indicating Economic Inflation Trends
Premium
Displaying central rectangular digital data panel in cyberspace, with binary grids and line graphs. Futuristic, digital, abstract, high-tech, data, visualization, cyber
Abstract Financial Graph with Rising Waves on Red Gradient
Neon Social Media Analytics Line Chart with Engagement Bubbles Showing Likes Comments
Financial Stock Market Data Visualization with Declining Trends
Data Trends and Analysis on 3D Digital Grid
Premium
Displaying pie chart splitting magenta segments on dark grid, with neon pillars and percent labels. Futuristic, data, visualization, holographic, analytics, technology, interface
Dynamic Graph with Glowing Points Representing Financial Data
Real-Time Financial Data Analysis with Graphs and Charts
Analyzing Financial Data with Business Charts Against Urban Skyline
Analyzing Stock Market Trends with Dynamic Graphs and Data
Premium
Displaying 3D globe streaming binary code in analytics dashboard, with bar and line graphs, tables. Technology, data, visualization, digital, futuristic, interface, intelligence
Stagflation Concept with Financial Data and Digital Interface
Slumpflation Concept with Data and Graph Interface
Futuristic Neon Soccer Field Over HUD Interface
Dynamic Financial Data Visualization on Digital Grid Background
Dynamic Stock Market Chart with Fluctuating Trends and Data Points
Premium
display of a digital data grid in blue tones
Digital Finance: Modern Stock Market Analysis Display
Analyzing Financial and Environmental Data Trends on Digital Interface
Dynamic Financial Data on Digital Screen
Digital Financial Data Graph Showcasing Market Trends
Financial Growth Curve Over City Skyline Displaying Business Trends
Premium
Stylized head hovering in virtual data interface, with dot matrix overlay and colored line graphs. Futuristic, technology, analytics, digital, interface, high-tech, data visualization
Dynamic Financial Market Graph Amidst Digital Equations
Abstract Digital Data Visualization with Line Graph on Purple Background
Futuristic Financial Data Analysis with Rising White Line Graph
Futuristic Digital Data Analytics Interface Display
Premium
Pulsing purple 3D grid tunnel streaming inside virtual data interface with floating ticker symbols. Futuristic, technology, digital, data, cybernetic, interface, innovation
Dynamic Financial Data Analytics with Interactive Visual Elements
City Skyline with Overlay of Financial Market Trends
Digital Data Flow Over 3D Grid with Blue Graph Representation
Global Analytics with Futuristic Interface and Grid Overlay
Premium
Displaying 3D globe showing bar chart and line plot in virtual dashboard, with pie chart. Data visualization, analytics, digital interface, dashboard, business intelligence, tech innovation,
Global Networking Concept with 6G Technology Display
Digital Finance Chart Overlaying Globe Background
Dynamic Financial Data Display in Digital Space
Financial Data Analysis Over Green Grid Background
Premium
Displaying digital semi-transparent 3D bars rising on dark blue grid, with red line graph overlay. Futuristic, data analytics, 3d visualization, technology, abstract, digital interface, insight
Global Data Analytics on Digital Grid Interface
Digital Financial Data Overlaying City Skyline at Dusk
Abstract Digital Graphs Showing Financial Data Analysis
Advanced Financial Charting with Zigzag Indicator and Trends
Premium
Displaying abstract network floating in dark virtual space, with glowing nodes and data panels. Futuristic, cyberspace, data visualization, digital, technology, innovation, geometric
Financial Data Analysis with Global Digital Interface
Abstract Financial Graph with Glowing Node on Grid Background
Financial Data Displayed Over City Skyline with Rising Graphs
Dynamic Forex Trading Graphs with Increasing Numbers
Futuristic Data Graph Overlay on City Skyline
Digital Stock Market Green Graph Against Dark Trading Board
Financial Graphs Overlaying Shopping Bag Representation Economy
Data Visualization on Digital Interface with Graphs and Codes
Stock Market Trends and Data Analysis
Dynamic Financial Graphs Overlaying Modern Cityscape
Red Downtrend Line Falling Across Digital Financial Dashboard With Teal Indicator Dots
Digital Interface Display Over Urban Skyline for Financial Analytics
Dynamic Stock Market Graph Displaying Surging Growth
Premium
Displaying futuristic HUD with concentric rings, dot in dark grid space, bar charts and line graphs. Technology, innovation, data, analysis, interface, digital, network
Financial Dashboard with Line and Bar Graphs for Market Analysis
Glowing Data Lines on Financial Graph Grid Background
Digital Data Analytics Overlay on Cityscape
Global Economy Displaying Growth Trends with Ukraine-NATO Financial Outlook
Premium
Displaying holographic 3D globe floating on dashboard, with numeric overlays line charts bar graphs. Technology, data, analytics, futuristic, innovation, visualization, digital
Abstract Digital Data Network with Graphs and Symbols
Dynamic Stock Market Graphs Over Digital Interface
Financial Data Analysis with Declining Trends
Dynamic Financial Data Visualizations on Grid Interface
Premium
Showing 3D bar chart columns emerging on holographic grid, with line graphs and numeric labels. Futuristic, data, analytics, holographic, visualization, digital, market
Data Visualization Overlay on Hills with Global Focus
Abstract Data Visualization with Dynamic Charts and Graphs
European Market Data Overlay with EU Flag and Financial Graphs
Futuristic Graph with Digital Globe Symbolizing Global Technology Connections
Premium
Displaying cyan wireframe car model on grid floor in data studio, with bar charts and timestamp. Technology, data, analytics, simulation, virtual, futuristic, digital
Financial Data Charts in Shimmering Blue Digital Space
Line Graph Illustrating Data Trend on Green Digital Background
Digital Stock Market Graph Red Trendline on Green Background
Financial Growth Stock Nikkei in Urban City Skyline
Premium
Projecting holographic interface hovering in virtual data space, with bar graphs and code blocks. Technology, futurism, digital, data visualization, cybersecurity, innovation, interface
Explore More Free Stock Images