- Home >
- Stock Photos >
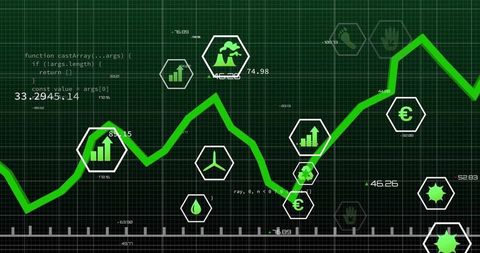
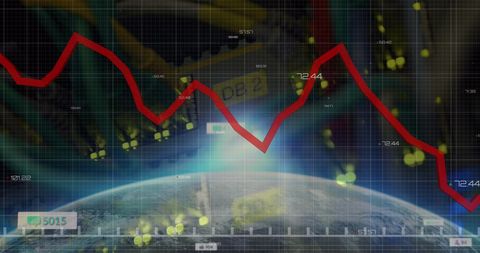
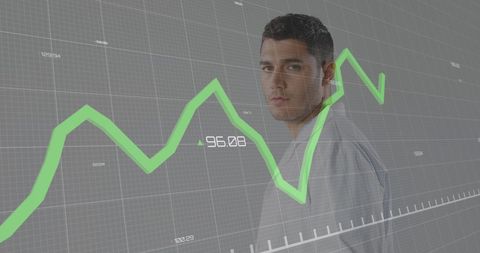
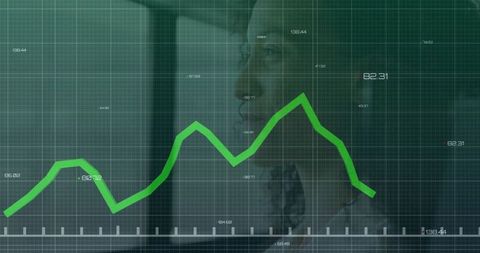
- Dynamic Graph Analysis over Covid-19 Virus Cells
Dynamic Graph Analysis over Covid-19 Virus Cells Image

Displays intersecting themes of global pandemic data analysis with futuristic technological visualization. Useful for representations in healthcare analytics, COVID-19 research, technology-in-health issues, or educational illustrations concerning pandemic impact in statistics and data trends in the digital era.

downloads
Tags:
More
Credit Photo
If you would like to credit the Photo, here are some ways you can do so
Text Link
photo Link
<span class="text-link">
<span>
<a target="_blank" href=https://pikwizard.com/photo/dynamic-graph-analysis-over-covid-19-virus-cells/852b1c8be01b2e9cf2211624a50e0749/>PikWizard</a>
</span>
</span>
<span class="image-link">
<span
style="margin: 0 0 20px 0; display: inline-block; vertical-align: middle; width: 100%;"
>
<a
target="_blank"
href="https://pikwizard.com/photo/dynamic-graph-analysis-over-covid-19-virus-cells/852b1c8be01b2e9cf2211624a50e0749/"
style="text-decoration: none; font-size: 10px; margin: 0;"
>
<img src="https://pikwizard.com/pw/medium/852b1c8be01b2e9cf2211624a50e0749.jpg" style="margin: 0; width: 100%;" alt="" />
<p style="font-size: 12px; margin: 0;">PikWizard</p>
</a>
</span>
</span>
Free (free of charge)
Free for personal and commercial use.
Author: Authentic Images