- Home >
- Stock Photos >
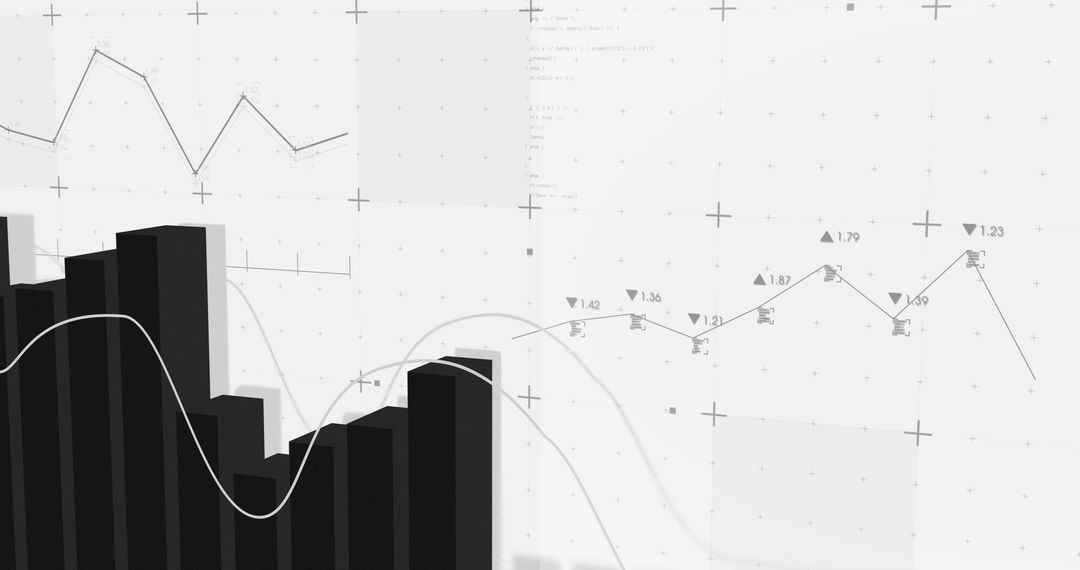
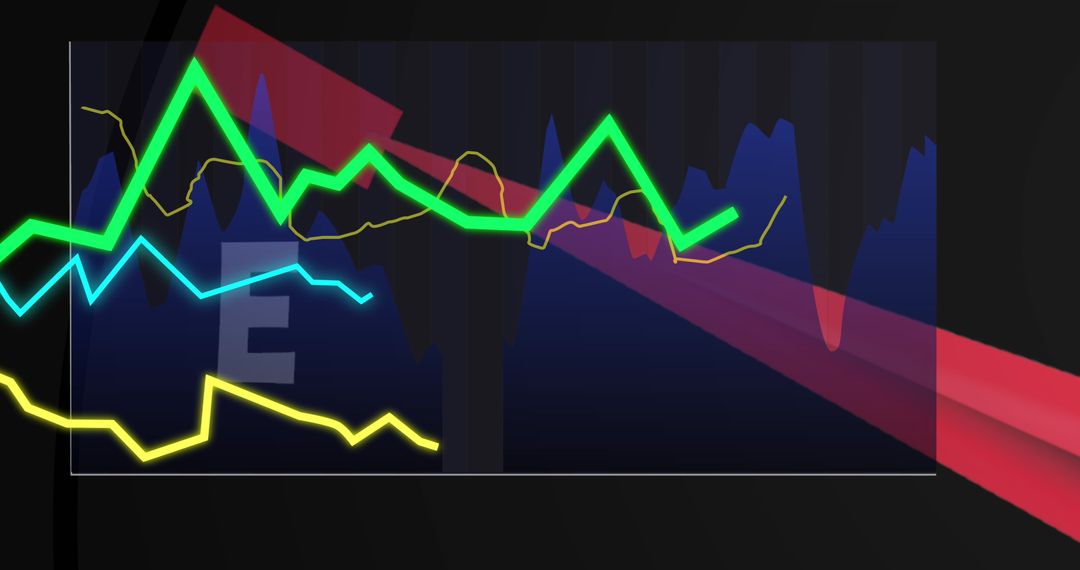
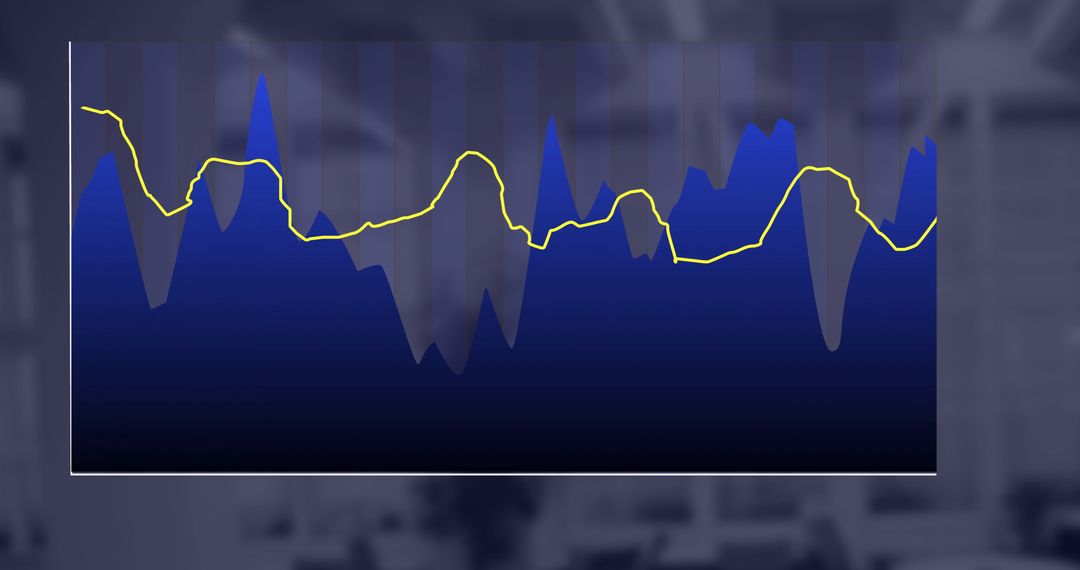
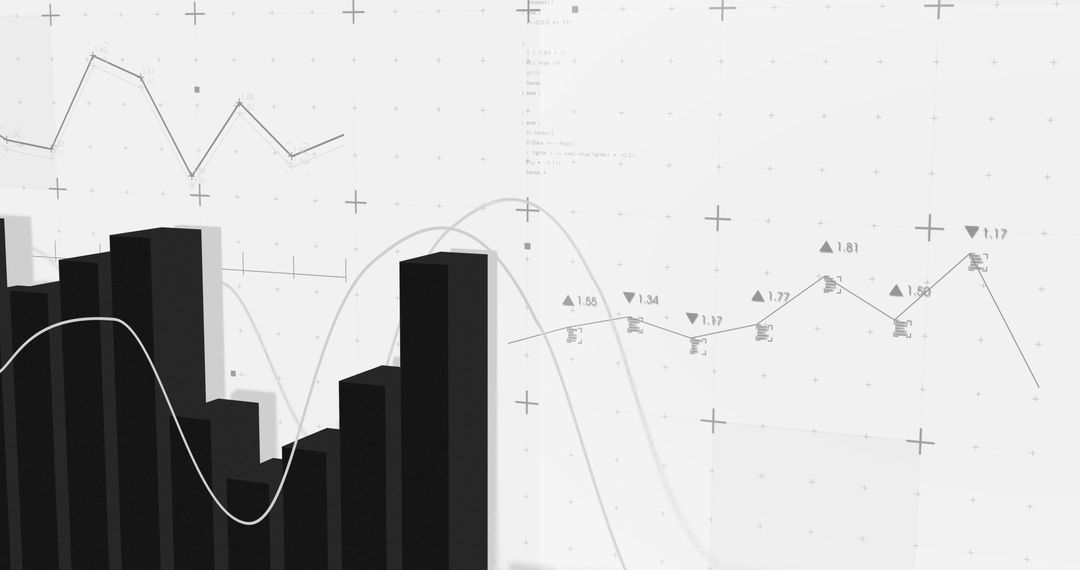
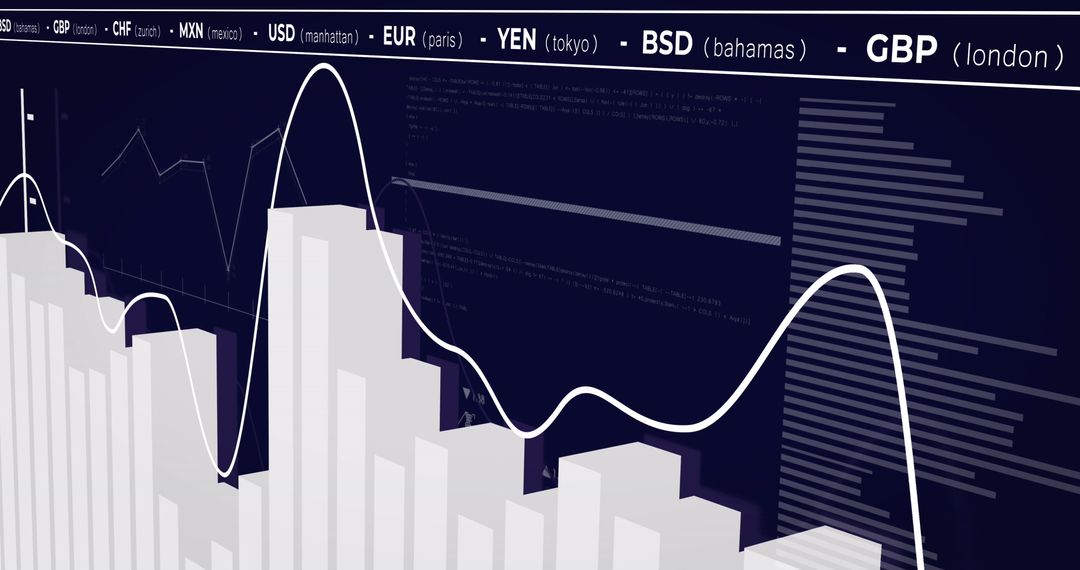
- Dynamic Graph Highlighting Stock Market Fluctuations
Dynamic Graph Highlighting Stock Market Fluctuations Image

This visual illustration of a graph with fluctuating Stock market data is ideal for presentations related to finance, investment strategies, and economic analysis. The glowing line on the graph represents economic trends making it a great choice for websites, financial reports, or educational materials discussing market dynamics.
Powered by  - Get 15% off with code: PIKWIZARD15


2
downloads
downloads
Tags:
More
Credit Photo
If you would like to credit the Photo, here are some ways you can do so
Text Link
photo Link
<span class="text-link">
<span>
<a target="_blank" href=https://pikwizard.com/photo/dynamic-graph-highlighting-stock-market-fluctuations/938a4431ac50cfa1030fed927d2ed309/>PikWizard</a>
</span>
</span>
<span class="image-link">
<span
style="margin: 0 0 20px 0; display: inline-block; vertical-align: middle; width: 100%;"
>
<a
target="_blank"
href="https://pikwizard.com/photo/dynamic-graph-highlighting-stock-market-fluctuations/938a4431ac50cfa1030fed927d2ed309/"
style="text-decoration: none; font-size: 10px; margin: 0;"
>
<img src="https://pikwizard.com/pw/medium/938a4431ac50cfa1030fed927d2ed309.jpg" style="margin: 0; width: 100%;" alt="" />
<p style="font-size: 12px; margin: 0;">PikWizard</p>
</a>
</span>
</span>
Free (free of charge)
Free for personal and commercial use.
Author: Creative Art
Similar Free Stock Images

Premium


Premium


Premium


Premium


Premium


Premium


Premium


Premium


Premium


Premium


Premium


Premium


Premium


Premium


Premium


Premium


Premium


Premium


Premium


Premium


Premium


Premium


Premium


Premium