- Home >
- Stock Photos >
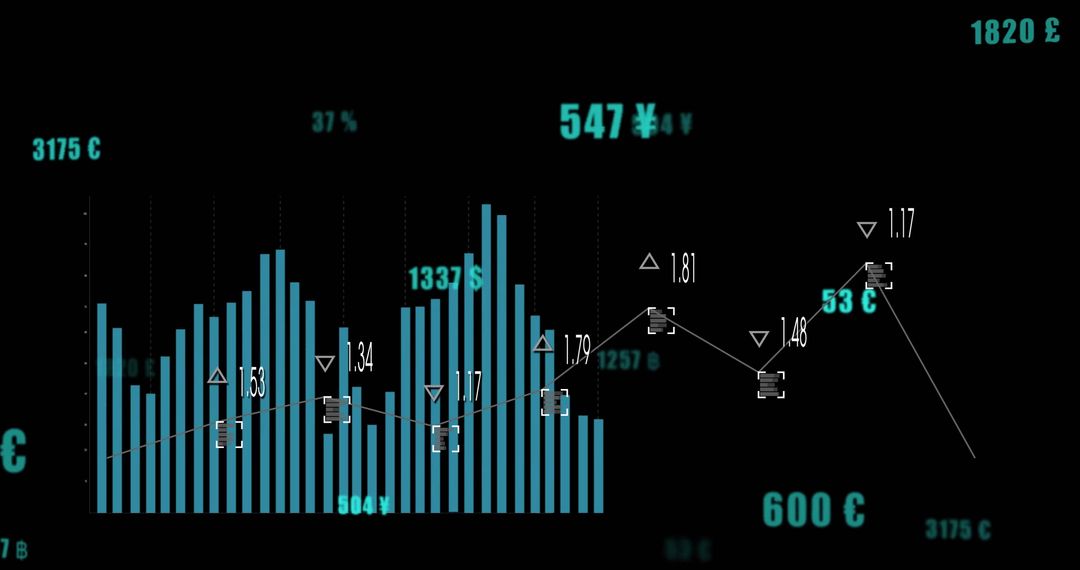
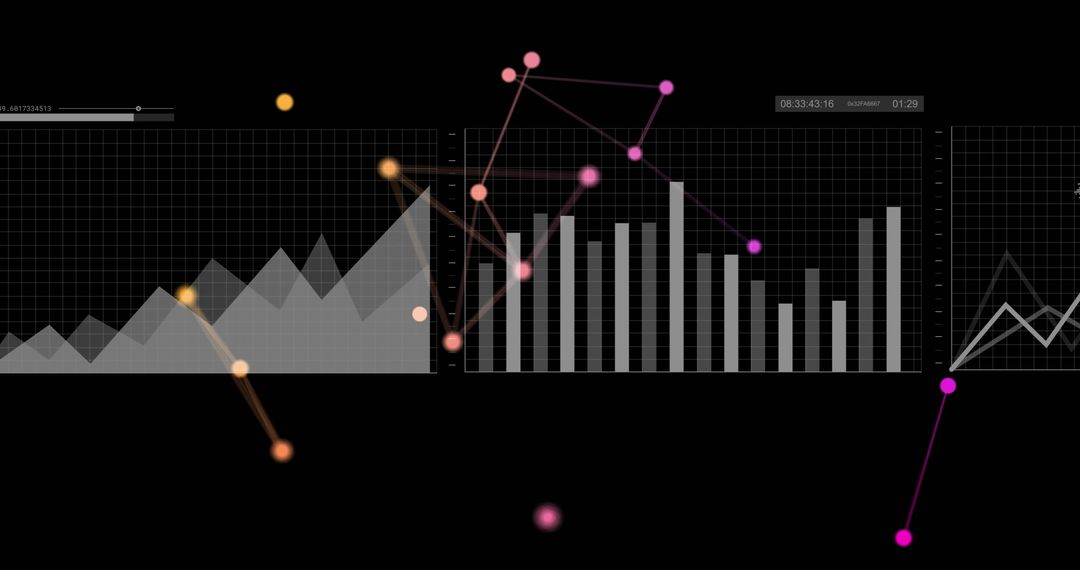
- Dynamic Graphs on Black Background for Financial Technology Concepts
Dynamic Graphs on Black Background for Financial Technology Concepts Image

Visually striking bars and various digital icons are contrasted with a black background, demonstrating technology and financial data manipulation. Ideal for illustrating financial reports, economic analysis articles, and innovative technology solutions in business sectors.
Powered by 


2
downloads
downloads
Tags:
More
Credit Photo
If you would like to credit the Photo, here are some ways you can do so
Text Link
photo Link
<span class="text-link">
<span>
<a target="_blank" href=https://pikwizard.com/photo/dynamic-graphs-on-black-background-for-financial-technology-concepts/5addcf341a65f48bc568da713368691e/>PikWizard</a>
</span>
</span>
<span class="image-link">
<span
style="margin: 0 0 20px 0; display: inline-block; vertical-align: middle; width: 100%;"
>
<a
target="_blank"
href="https://pikwizard.com/photo/dynamic-graphs-on-black-background-for-financial-technology-concepts/5addcf341a65f48bc568da713368691e/"
style="text-decoration: none; font-size: 10px; margin: 0;"
>
<img src="https://pikwizard.com/pw/medium/5addcf341a65f48bc568da713368691e.jpg" style="margin: 0; width: 100%;" alt="" />
<p style="font-size: 12px; margin: 0;">PikWizard</p>
</a>
</span>
</span>
Free (free of charge)
Free for personal and commercial use.
Author: Authentic Images
Similar Free Stock Images

Premium


Premium


Premium


Premium


Premium


Premium


Premium


Premium


Premium


Premium


Premium


Premium


Premium


Premium


Premium


Premium


Premium


Premium


Premium


Premium


Premium


Premium


Premium


Premium