- Home >
- Stock Photos >
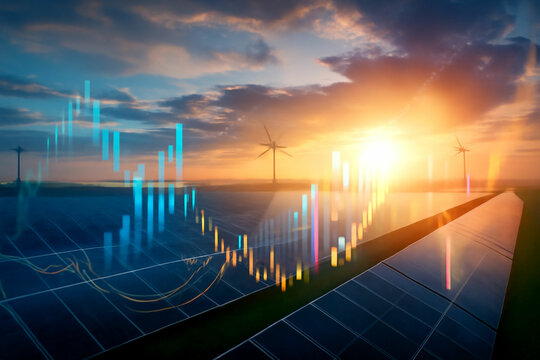
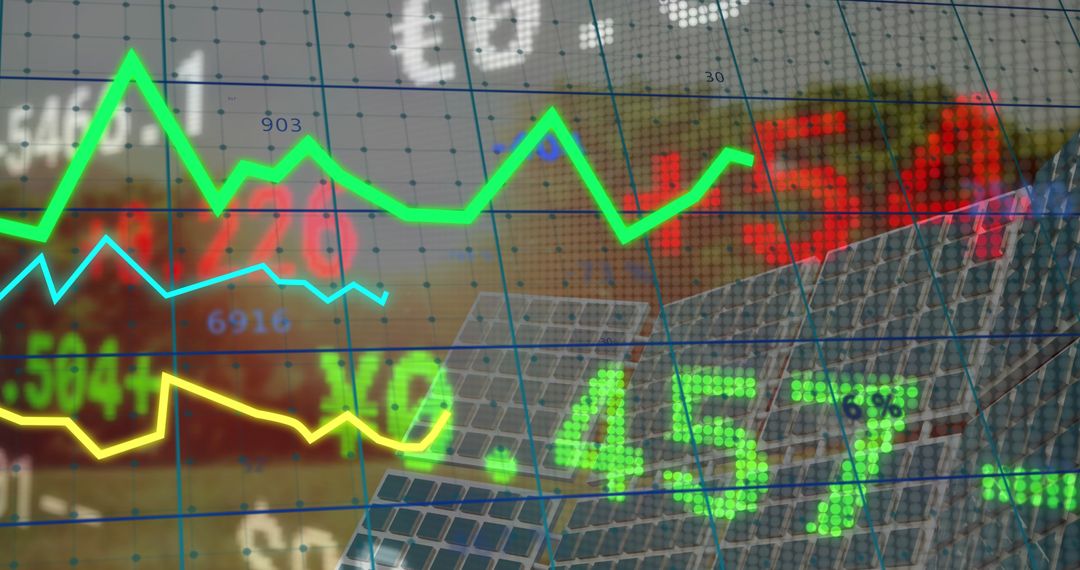
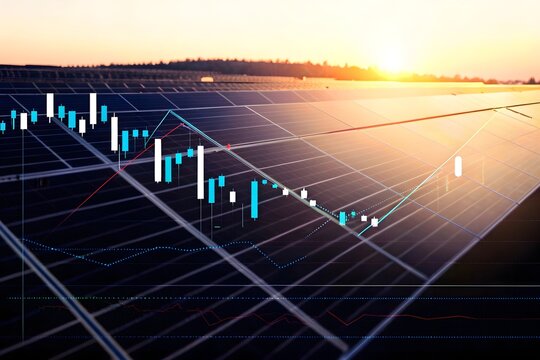
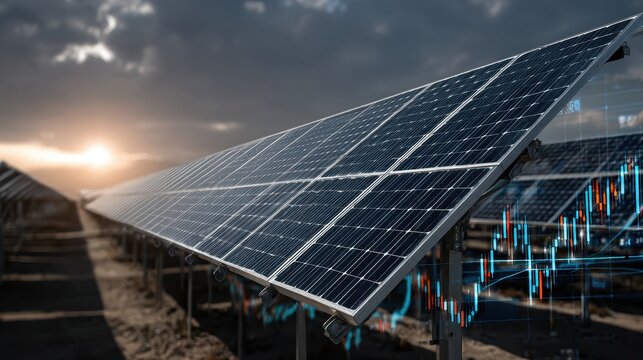
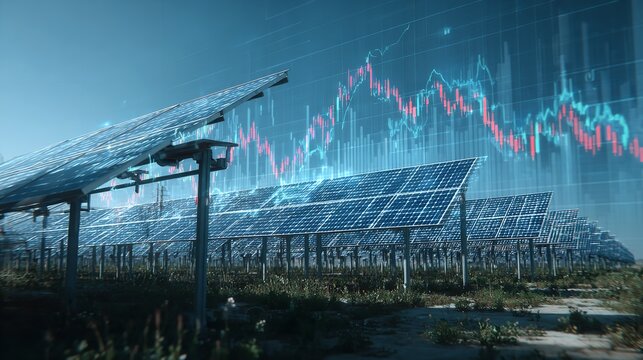
- Dynamic Graphs Over Solar Panels and Storage Battery Concept
Dynamic Graphs Over Solar Panels and Storage Battery Concept Image

Shows juxtaposition of a fluctuating stock or financial graph overlaid on solar panels and a battery. Useful for illustrating trends in renewable energy investments, financial technology growth, and sustainability debates in an economic context. Ideal for use in business presentations, financial analyses, or articles about energy trends.
Powered by 


2
downloads
downloads
Tags:
More
Credit Photo
If you would like to credit the Photo, here are some ways you can do so
Text Link
photo Link
<span class="text-link">
<span>
<a target="_blank" href=https://pikwizard.com/photo/dynamic-graphs-over-solar-panels-and-storage-battery-concept/915e5ce51be9114cd0f0f994229ddcef/>PikWizard</a>
</span>
</span>
<span class="image-link">
<span
style="margin: 0 0 20px 0; display: inline-block; vertical-align: middle; width: 100%;"
>
<a
target="_blank"
href="https://pikwizard.com/photo/dynamic-graphs-over-solar-panels-and-storage-battery-concept/915e5ce51be9114cd0f0f994229ddcef/"
style="text-decoration: none; font-size: 10px; margin: 0;"
>
<img src="https://pikwizard.com/pw/medium/915e5ce51be9114cd0f0f994229ddcef.jpg" style="margin: 0; width: 100%;" alt="" />
<p style="font-size: 12px; margin: 0;">PikWizard</p>
</a>
</span>
</span>
Free (free of charge)
Free for personal and commercial use.
Author: Creative Art
Similar Free Stock Images

Premium


Premium


Premium


Premium


Premium


Premium


Premium


Premium


Premium


Premium


Premium


Premium


Premium


Premium


Premium


Premium


Premium


Premium


Premium


Premium


Premium


Premium


Premium


Premium