
- Home >
- Stock Photos >
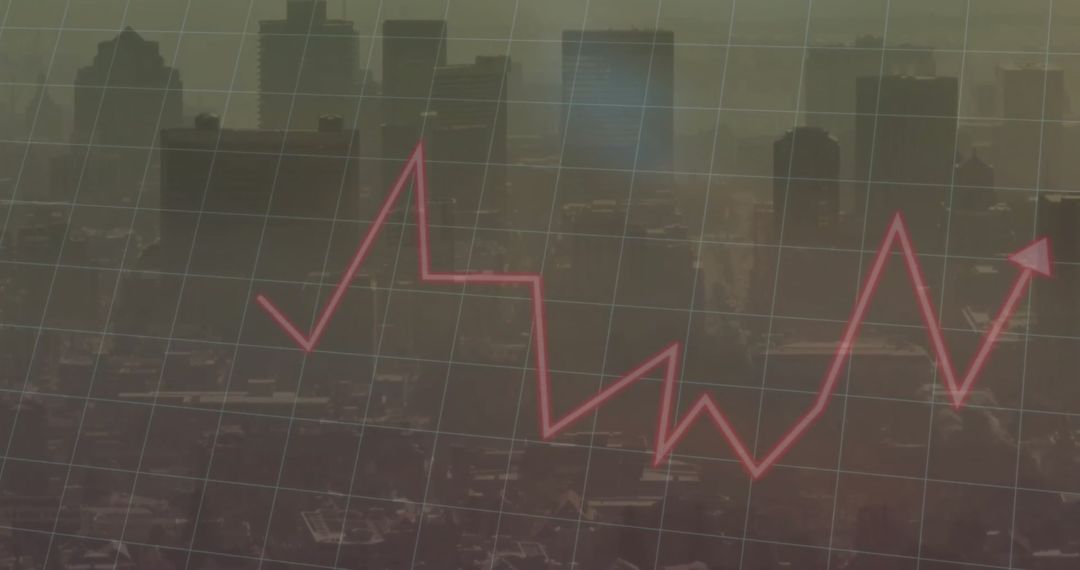
- Dynamic Graphs Overlay on Office Scene Illustrating Trends
Dynamic Graphs Overlay on Office Scene Illustrating Trends Image

This composition portrays a dynamic blend of analytical graphs overlaying a bustling office environment. It is perfect for depicting themes related to data analysis, business planning, or corporate results. Ideal for use in presentations, business reports, articles on data trends, or marketing materials emphasizing growth and strategy in a corporate setting.
Powered by 


2
downloads
downloads
Tags:
More
Credit Photo
If you would like to credit the Photo, here are some ways you can do so
Text Link
photo Link
<span class="text-link">
<span>
<a target="_blank" href=https://pikwizard.com/photo/dynamic-graphs-overlay-on-office-scene-illustrating-trends/621b6f1a43ee23d0acc58474cbefcd84/>PikWizard</a>
</span>
</span>
<span class="image-link">
<span
style="margin: 0 0 20px 0; display: inline-block; vertical-align: middle; width: 100%;"
>
<a
target="_blank"
href="https://pikwizard.com/photo/dynamic-graphs-overlay-on-office-scene-illustrating-trends/621b6f1a43ee23d0acc58474cbefcd84/"
style="text-decoration: none; font-size: 10px; margin: 0;"
>
<img src="https://pikwizard.com/pw/medium/621b6f1a43ee23d0acc58474cbefcd84.jpg" style="margin: 0; width: 100%;" alt="" />
<p style="font-size: 12px; margin: 0;">PikWizard</p>
</a>
</span>
</span>
Free (free of charge)
Free for personal and commercial use.
Author: People Creations
Similar Free Stock Images

Premium


Premium


Premium


Premium


Premium


Premium


Premium


Premium


Premium


Premium


Premium


Premium


Premium


Premium


Premium


Premium


Premium


Premium


Premium


Premium


Premium


Premium


Premium


Premium

