- Home >
- Stock Photos >
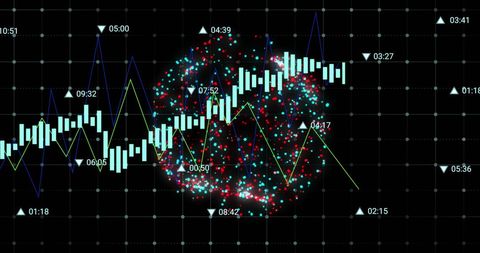
- Dynamic Graphs Showing Stock Market Trends
Dynamic Graphs Showing Stock Market Trends Image

Digital graphs and charts displaying intricate stock market data and financial trends. Useful for presentations on finance, stock analysis, economy insights, investment planning, and financial reporting themes.
Powered by 


Credit Photo
If you would like to credit the Photo, here are some ways you can do so
Text Link
photo Link
<span class="text-link">
<span>
<a target="_blank" href=https://pikwizard.com/photo/dynamic-graphs-showing-stock-market-trends/34727dbb2d4f6dd7ca62219a003f581e/>PikWizard</a>
</span>
</span>
<span class="image-link">
<span
style="margin: 0 0 20px 0; display: inline-block; vertical-align: middle; width: 100%;"
>
<a
target="_blank"
href="https://pikwizard.com/photo/dynamic-graphs-showing-stock-market-trends/34727dbb2d4f6dd7ca62219a003f581e/"
style="text-decoration: none; font-size: 10px; margin: 0;"
>
<img src="https://pikwizard.com/pw/medium/34727dbb2d4f6dd7ca62219a003f581e.jpg" style="margin: 0; width: 100%;" alt="" />
<p style="font-size: 12px; margin: 0;">PikWizard</p>
</a>
</span>
</span>
Free (free of charge)
Free for personal and commercial use.
Author: People Creations
Similar Free Stock Images
Loading...

Premium


Premium

Premium


Premium


Premium


Premium


Premium


Premium

Premium

Premium


Premium


Premium

Premium


Premium


Premium


Premium


Premium


Premium


Premium


Premium


Premium

Premium


Premium


Premium


Premium