- Home >
- Stock Photos >
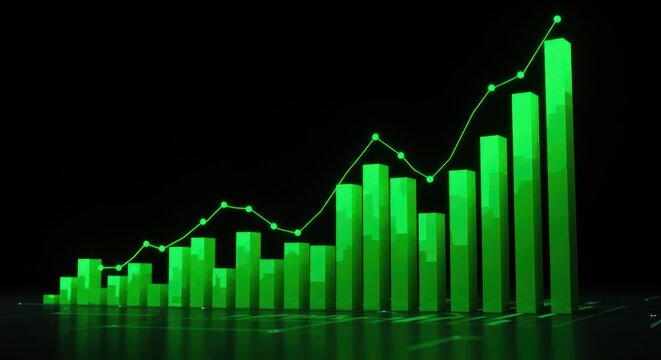
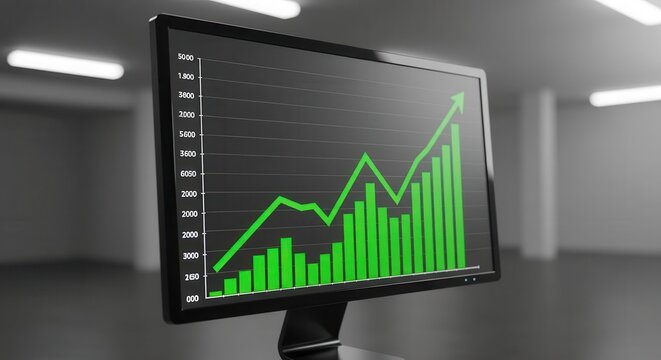
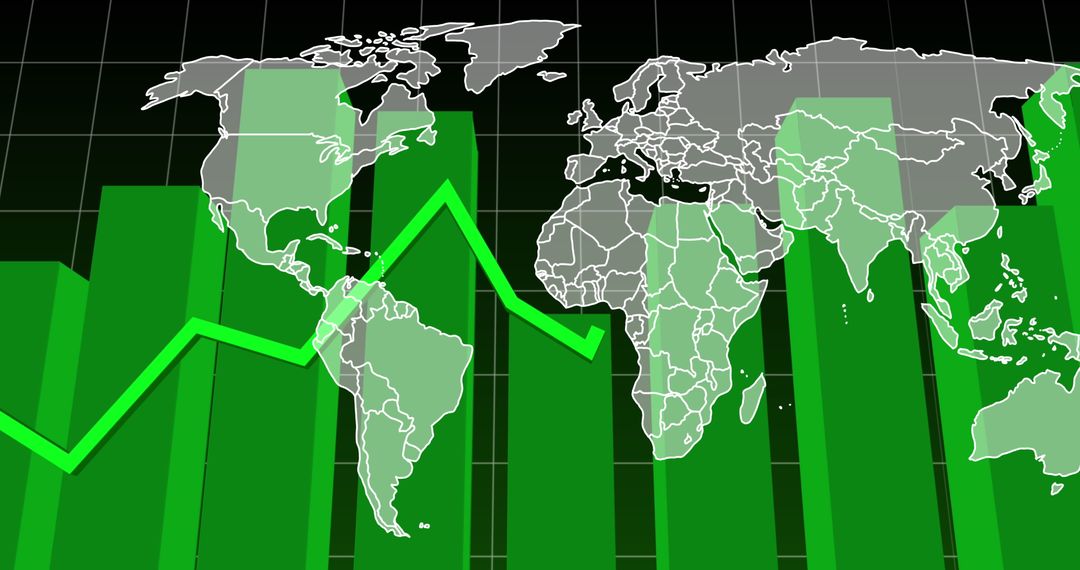
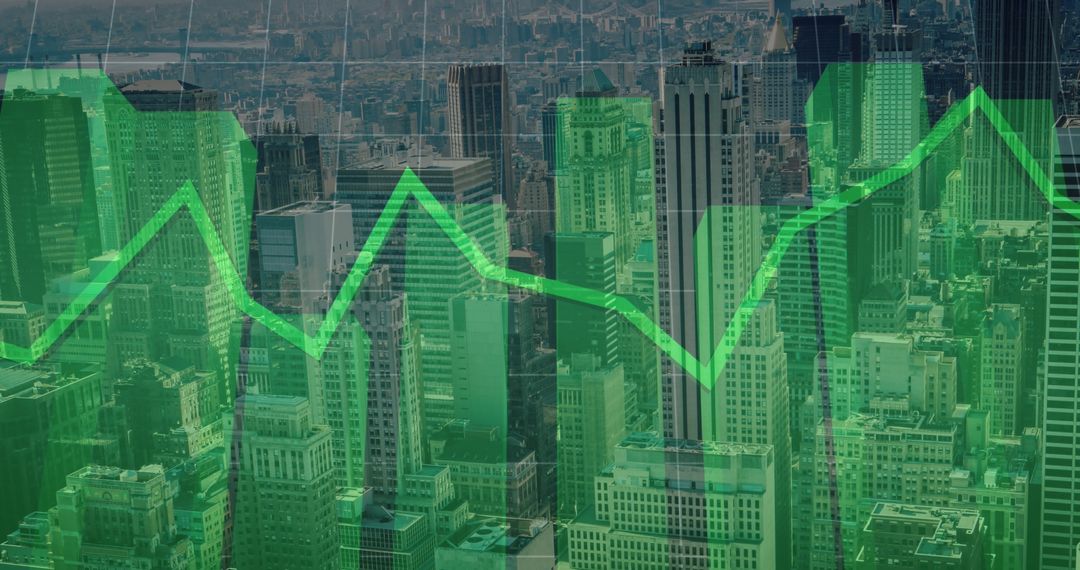
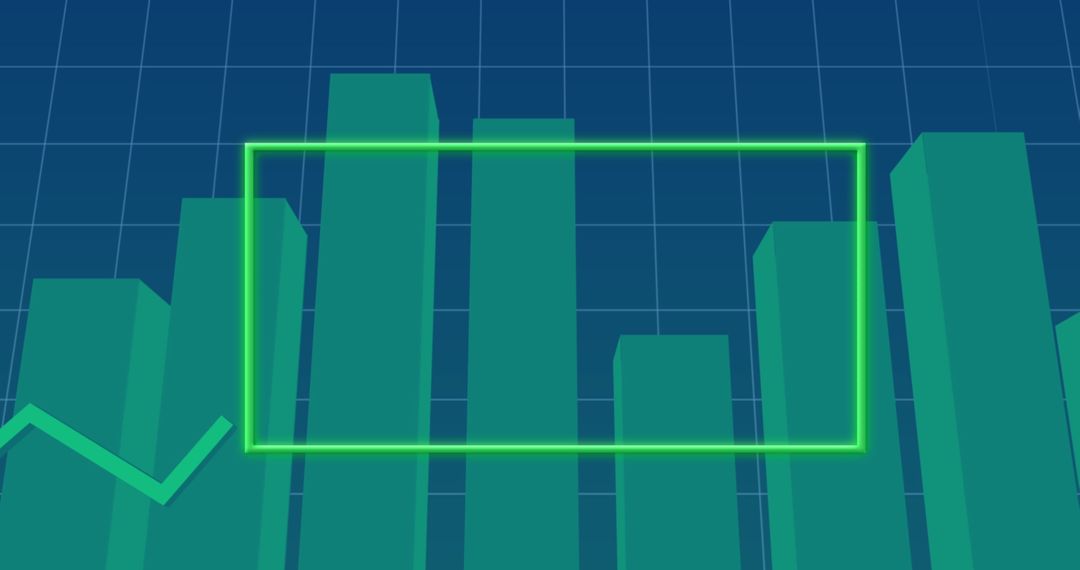
- Dynamic Green Bar Graph with Rising Line in Digital Art Style
Dynamic Green Bar Graph with Rising Line in Digital Art Style Image

Graphic features a green bar graph combined with a rising line, set against a dark, grid-styled background. Ideal for usage in presentations about business growth, financial analytics, market trends, and data-driven decision making. Suitable for digital strategy and economic forecast illustrations.
Powered by 


2
downloads
downloads
Tags:
More
Credit Photo
If you would like to credit the Photo, here are some ways you can do so
Text Link
photo Link
<span class="text-link">
<span>
<a target="_blank" href=https://pikwizard.com/photo/dynamic-green-bar-graph-with-rising-line-in-digital-art-style/336e6a7e7b14dd10da3037c41fb326dd/>PikWizard</a>
</span>
</span>
<span class="image-link">
<span
style="margin: 0 0 20px 0; display: inline-block; vertical-align: middle; width: 100%;"
>
<a
target="_blank"
href="https://pikwizard.com/photo/dynamic-green-bar-graph-with-rising-line-in-digital-art-style/336e6a7e7b14dd10da3037c41fb326dd/"
style="text-decoration: none; font-size: 10px; margin: 0;"
>
<img src="https://pikwizard.com/pw/medium/336e6a7e7b14dd10da3037c41fb326dd.jpg" style="margin: 0; width: 100%;" alt="" />
<p style="font-size: 12px; margin: 0;">PikWizard</p>
</a>
</span>
</span>
Free (free of charge)
Free for personal and commercial use.
Author: Authentic Images
Similar Free Stock Images

Premium


Premium


Premium


Premium


Premium


Premium


Premium


Premium


Premium


Premium


Premium


Premium


Premium


Premium


Premium


Premium


Premium


Premium


Premium


Premium


Premium


Premium


Premium


Premium