1. Home > 
  2. Stock Photos > 
  3. Dynamic Green Data Chart on Futuristic Digital Interface Background

Dynamic Green Data Chart on Futuristic Digital Interface Background Image

Dynamic Green Data Chart on Futuristic Digital Interface Background

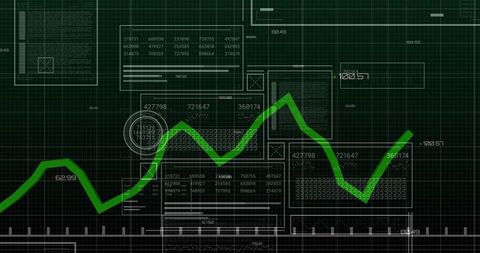
Illustration of a green line graph traversing a complex electronic background with grid marks and circular accents. Suitable for representation of market trends, technological analysis, or financial forecasting. Useful for articles, reports, presentations or blogs discussing data science, finance, or future technology trends.

Powered by Adobe logo
Augmented reality interface displaying digital data and analytics over a bustling modern city street, enhancing urban life and pedestrian navigation. - Powered by AdobeHand touching futuristic chart showing business data growth and analytics with rising digital graph interface - Powered by AdobeFuturistic data visualization with glowing graphs, holographic charts, and dynamic digital elements, conveying insight, analysis, and advanced technology in a sleek modern style.
 - Powered by AdobeFuturistic Holographic Digital Interface with Graphs Charts and Code Displays. - Powered by AdobeFuturistic technology data visualization virtual screen male silhouette dark room blue light digital interface analytics dashboard modern business - Powered by Adobe

Credit Photo

If you would like to credit the Photo, here are some ways you can do so

Free (free of charge)

Free for personal and commercial use.

Author: Creative Art

Similar Free Stock Images

Digital Data Prozessing with Global Interface Design
Premium
Man in suit observing multiple digital screens displaying data and analytics in a high-tech control room
Futuristic Finance Dashboard with AI Technology and Data Visualization
Premium
glowing digital world map with blue pixel continents and orange data streams conveying dynamic global connectivity
Premium
Futuristic glowing blue digital dashboard with interactive charts graphs and analytics showing upward growth trend for business financial and technology data visualization concepts
Dynamic Data Analysis on Digital Graph, Technology Background
Tracking rising market trend with bold green line on futuristic trading dashboard display
Green Trend Line on Dark Grid Represents Economic Growth
Futuristic data waveform tracking green trend line across blue helix analytics grid
Financial Growth Graph on Green Digital Grid Background
Green Line Chart Overlay on Hazy Cityscape
Futuristic AI Concept with Digital Circuitry and Rising Arrows
Digital Data Processing with Graph and Grid Technology Interface
Premium
Woman interacting with abstract digital data interface projection
Futuristic NFT Market Analysis with Glowing Graphics
Rising Financial Graph on Dark Grid Background
Futuristic Energy Tracking with Rocket Blueprint and Data Analytics
Digital Cardiograph on Black Background in Colorful Display
Premium
Data Analytics and Business Intelligence Strategy with Interactive Dashboard Interface.
Neon Green Line Chart with Circular Markers on Futuristic Grid Dashboard for Data Analytics
Neon Green ECG-Style Waveform on Digital Black Grid
Digital Analytics with Binary Data and Green Chart Line
Premium
Business analytics dashboard with hands typing on laptop and data interface overlay.
Glowing Blue Cardiograph on Black Background Interface
Advanced Financial Charting with Zigzag Indicator and Trends
Digital Sound Wave with Frequency Bars on Dark Blue Background
Dotted DNA helix weaving through biotech analytics dashboard with colorful data graphs
Premium
Doctor using digital tablet and laptop with AI dashboard holographic checklist overlay, analyzing KPI, workflow process, and compliance data visualization in modern healthcare digital environment.
Dynamic Stagflation Concept Displaying Economic Burdens
Abstract Representation of Financial Data Processing
Digital Financial Data Display with Graph and Grid
Premium
magnifying glass over a glowing digital network and data nodes on a keyboard or circuit board in blue and orange hues, evoking discovery and focused investigation
Abstract Digital Waveform Visualization in Futuristic Dashboard
Futuristic Data Dashboard with Graph and Code Overlay
Neon Magenta Zigzag Waveform with Cyan Trendline and Candlestick Bars on Futuristic Data Grid
Digital Data Stream With Futuristic Green Waveform
Dynamic Financial Graph in Virtual Red Grid Background
Digital Graph Display with Dynamic Flux on Purple Background
Premium
Visual representation of digital marketing metrics and ads on a futuristic interface, showcasing data analysis through charts and graphs in a modern business setting. Gantry
Premium
Data analysis funnel insight hand holographic A human hand manipulating a holographic data funnel filtering chaotic particles into an organized beam light conveying discovery
Premium
Hand presenting a glowing blue digital bar chart, visualizing data analysis, financial increase, market success, and technological business growth on a transparent interface
Premium
modern office workspace with large display screens presenting business data analytics
Interactive Line Graph Dashboard with Coding Background
Digital Data Analysis with Green Line Graph on Grid Background
Rising Graph Line on Digital Green Grid Background
Futuristic Data Visualization Graph Vector Rising Trend
Premium
UX improvement optimization user flow usability tasks data analysis performance metrics charts graphs digital interface technology
Interactive Financial Dashboard Visualizing Bar Charts and Line Trends on Futuristic Grid
Green Line Graph with Data Points on Grid Background
Line Graphs on Digital Background Show Financial Data Trends
Pulsing Neon Green Waveform Across Dark Ocean Horizon with 3D Grid Nodes and Stormy Sky
Premium
Futuristic circular data visualization hub with glowing blue network connections and digital interface
AI
Pulsing Neon Waveform with Futuristic Interface and Data Analytics
Dynamic Financial Graph on Luminous Green Background
Futuristic Green Line Graph on Digital Grid Background
Abstract Digital Finance Chart Showing Fluctuating Graph Lines
Premium
Abstract visualization of data metrics with glowing bars in various colors representing analytics and performance trends in a digital environment
Digital Graph Displaying Dynamic Data Analysis
Digital Finance Chart Showing Growth Trends with Analytics Data
Dynamic Stock Market Chart with Grid and Trend Lines
Digital Financial Graph Over Violet Background in Abstract Style
Premium
A businessman activates a glowing RECAP button on a futuristic digital screen showing global data analytics in a modern business environment with bright lighting
Neon Cybersecurity Shield with Padlock Overlaying Jagged Data Graph on Futuristic Grid
Dynamic Financial Graph with Wavy Data Line over Navy Background
AI
Glowing Cyan Audio Waveform Across Digital Grid Panel
Data Analytics Dashboard with Neon Highlights
Dynamic Green Graph on Trading Dashboard Illustrating Market Trends
Financial Data Visualization with Colorful Graphs and Charts Representing Analytics
Neon AI Data Visualization Dashboard Displaying Neural-Tree Line Chart with Nodes
Financial Data Graphics Over World Map in Digital Style
Digital Financial Graph on Green Background Showing Rising Trends
Advanced Digital Dashboard with Rising Bar and Line Charts
Innovative Data Analysis with Dynamic Line Graph and Digital Elements
Futuristic Financial Graph with Data Overlays in Blue Holographic Style
Financial Growth Illustrated with Bar Charts and Upward Arrow
Futuristic Data Analytics Over Technical Blueprint Design
Stagflation Concept with Digital Financial Graphs
Visualizing social media engagement with neon analytics chart and interaction callouts
Futuristic Data Visualization with Green Line Graph and Analytics Interface
Premium
Person interacting with holographic user interface displaying data analytics and human profile visualization
Data Visualization with Rising Red Arrow and Floating Numbers
Abstract Digital Graph and Code on Violet Background
Digital Finance Chart Overlaying Globe Background
Financial Graph Analysis on Green Grid Background
Premium
Woman in augmented reality glasses future technology ai interface digital data visualization concept
Digital Financial Data Analyzing Over Circular Grid Display
Dynamic Financial Chart with Data Points on Red Grid Background
Digital Interface Showing Global Business Data Analytics
Glowing Teal Time Series Line Chart on Digital Dashboard Grid for Analytics Visualization
Premium
Business summary dashboard concept,modern interface showing data analytics icons,strategy visualization,and digital report analysis in office environment
Neon Green Data Trend Line Displaying Node Markers on Dark Grid with Waveform Overlays and BI
Modern Data Visualization with Neon Line and Red Histogram on 3D Grid
Financial Growth Stock Nikkei in Urban City Skyline
Graph Lines Portraying Financial Data Trends
Futuristic Digital Representation of DNA Strand
Dynamic Financial Graph on Purple Background
Premium
Abstract data stream visualization with colorful glowing binary light lines merging into digital information flow for big data analytics cloud computing and high speed networking
Futuristic Green Line Graph on Digital Display Panel
Digital Cardiograph Display with Green Line over Black Background
Futuristic Digital Cybersecurity with ECG Snap Against Code Screens
Digital Financial Data Analytics and Trend Graphs
Digital Data Processing with Chart in Futuristic Interface
Neon Green Electrocardiogram Wave on Black Background
Futuristic Global Finance Chart with Rotating Globe Animation
Futuristic Digital Analytics Interface with Line and Wave Graphs
Premium
AI finance business data analysis digital technology investment trading market stock, financial analyst using advanced holographic interface for global market insight, smart investment strategy
Premium
Personalized Marketing Strategy. Futuristic digital interface displaying data analytics and customer centric marketing elements such as consumer behavior, customer journey and satisfaction metrics.
Futuristic Candlestick Chart with Blueprint Grid
Green Line Graph on Dark Digital Grid
Digital Data Visualization with Green Graph and Scanning Beams
Dynamic Green Line Graph Depicting Financial Data
Premium
Businessman touching a futuristic digital interface with glowing data blocks and code for business analytics and innovation
Dynamic Green Line Chart on Black Grid Background
AI
Multicolored ECG Waveform Across Digital Medical Monitor
Complex Financial Data Graph with Multicolored Trends and Analytics
Overlaying fingerprint analytics with rising green line chart on dark grid cyber dashboard
Colorful Data Visualization on Dark Background
Premium
Dynamic digital interface on a modern device, showcasing an intricate network of data points and a clear upward trend, symbolizing technological progress and insightful analytics
Digital Stock Market Data with Floating Points on Black Background
Digital Interface with Global Financial Graphs Background
Futuristic Digital Graph Showing Data Trends on Analytic Interface
Line Graph Illustrating Data Trend on Green Digital Background
Premium
Neon smartphone world map global connection data visualization holographic display network lines dark background hand holding phone glowing edges futuristic interface
Green Data Line Sweeping Across Futuristic Dashboard Grid Showing Analytics Trend and Telemetry
Digital Graphs and Data Visualization on Green Background
Explore More Free Stock Images