
- Home >
- Stock Photos >
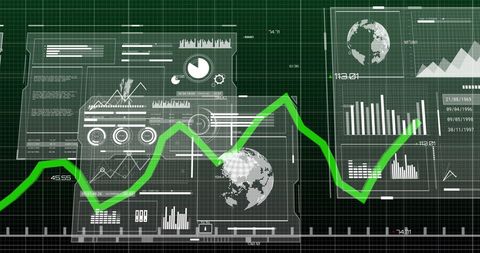
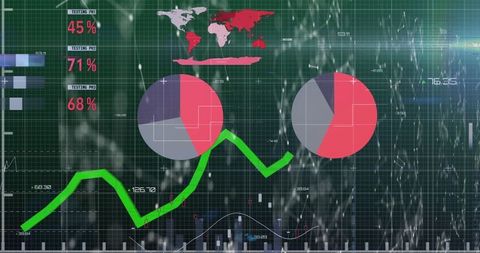
- Dynamic Green Financial Graph with Business Icons
Dynamic Green Financial Graph with Business Icons Image

This illustration portrays a dynamic green financial graph interwoven with business icons, symbolizing fluctuating economic trends. Useful for financial analytics, stock market forecasting, economic reports, or digital marketing materials focusing on investing or business intelligence.
Powered by  - Get 15% off with code: PIKWIZARD15


2
downloads
downloads
Tags:
More
Credit Photo
If you would like to credit the Photo, here are some ways you can do so
Text Link
photo Link
<span class="text-link">
<span>
<a target="_blank" href=https://pikwizard.com/photo/dynamic-green-financial-graph-with-business-icons/225a288aec8f322e624f65f763ac4e41/>PikWizard</a>
</span>
</span>
<span class="image-link">
<span
style="margin: 0 0 20px 0; display: inline-block; vertical-align: middle; width: 100%;"
>
<a
target="_blank"
href="https://pikwizard.com/photo/dynamic-green-financial-graph-with-business-icons/225a288aec8f322e624f65f763ac4e41/"
style="text-decoration: none; font-size: 10px; margin: 0;"
>
<img src="https://pikwizard.com/pw/medium/225a288aec8f322e624f65f763ac4e41.jpg" style="margin: 0; width: 100%;" alt="" />
<p style="font-size: 12px; margin: 0;">PikWizard</p>
</a>
</span>
</span>
Free (free of charge)
Free for personal and commercial use.
Author: Authentic Images
Similar Free Stock Images

Premium


Premium


Premium


Premium


Premium


Premium


Premium


Premium


Premium


Premium


Premium


Premium


Premium


Premium


Premium


Premium


Premium


Premium


Premium


Premium


Premium


Premium


Premium


Premium


Premium
