
- Home >
- Stock Photos >
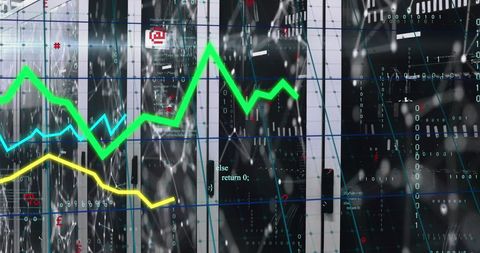
- Dynamic Green Graph on Futuristic Technological Interface
Dynamic Green Graph on Futuristic Technological Interface Image

Futuristic interface displays fluctuating green line graph among digital icons, representing technological and data analysis themes. Useful for websites and presentations related to technology development, financial analysis, data science research, or tech-based educational content.
Powered by 


downloads
Tags:
More
Credit Photo
If you would like to credit the Photo, here are some ways you can do so
Text Link
photo Link
<span class="text-link">
<span>
<a target="_blank" href=https://pikwizard.com/photo/dynamic-green-graph-on-futuristic-technological-interface/c45f1f10599e8c8dcb50d5ae661ec998/>PikWizard</a>
</span>
</span>
<span class="image-link">
<span
style="margin: 0 0 20px 0; display: inline-block; vertical-align: middle; width: 100%;"
>
<a
target="_blank"
href="https://pikwizard.com/photo/dynamic-green-graph-on-futuristic-technological-interface/c45f1f10599e8c8dcb50d5ae661ec998/"
style="text-decoration: none; font-size: 10px; margin: 0;"
>
<img src="https://pikwizard.com/pw/medium/c45f1f10599e8c8dcb50d5ae661ec998.jpg" style="margin: 0; width: 100%;" alt="" />
<p style="font-size: 12px; margin: 0;">PikWizard</p>
</a>
</span>
</span>
Free (free of charge)
Free for personal and commercial use.
Author: Authentic Images
Similar Free Stock Images

Premium


Premium


Premium

Premium


Premium


Premium


Premium


Premium


Premium


Premium


Premium


Premium

Premium


Premium

Premium


Premium

Premium

Premium


Premium


Premium


Premium


Premium


Premium


Premium

Premium


Explore More Free Stock Images