
- Home >
- Stock Photos >
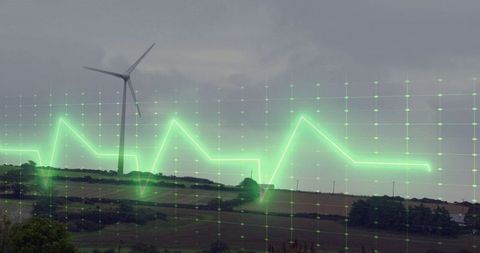
- Dynamic Green Graph on Trading Dashboard Illustrating Market Trends
Dynamic Green Graph on Trading Dashboard Illustrating Market Trends Image

Graph displaying market trends with neon green lines offers a modern visual. Useful for presentations on financial analysis, economic planning, or investment strategies, capturing dynamic market movements.
Powered by 


downloads
Tags:
More
Credit Photo
If you would like to credit the Photo, here are some ways you can do so
Text Link
photo Link
<span class="text-link">
<span>
<a target="_blank" href=https://pikwizard.com/photo/dynamic-green-graph-on-trading-dashboard-illustrating-market-trends/1b4a9c65ab22e5bca494e8a7ebe90538/>PikWizard</a>
</span>
</span>
<span class="image-link">
<span
style="margin: 0 0 20px 0; display: inline-block; vertical-align: middle; width: 100%;"
>
<a
target="_blank"
href="https://pikwizard.com/photo/dynamic-green-graph-on-trading-dashboard-illustrating-market-trends/1b4a9c65ab22e5bca494e8a7ebe90538/"
style="text-decoration: none; font-size: 10px; margin: 0;"
>
<img src="https://pikwizard.com/pw/medium/1b4a9c65ab22e5bca494e8a7ebe90538.jpg" style="margin: 0; width: 100%;" alt="" />
<p style="font-size: 12px; margin: 0;">PikWizard</p>
</a>
</span>
</span>
Free (free of charge)
Free for personal and commercial use.
Author: Authentic Images
Similar Free Stock Images

Premium


Premium

Premium


Premium


Premium


Premium

Premium

Premium

Premium


Premium


Premium

Premium


Premium


Premium

Premium


Premium

Premium

Premium


Premium

Premium


AI


Premium


Premium


Premium


Premium


Premium

Explore More Free Stock Images