
- Home >
- Stock Photos >
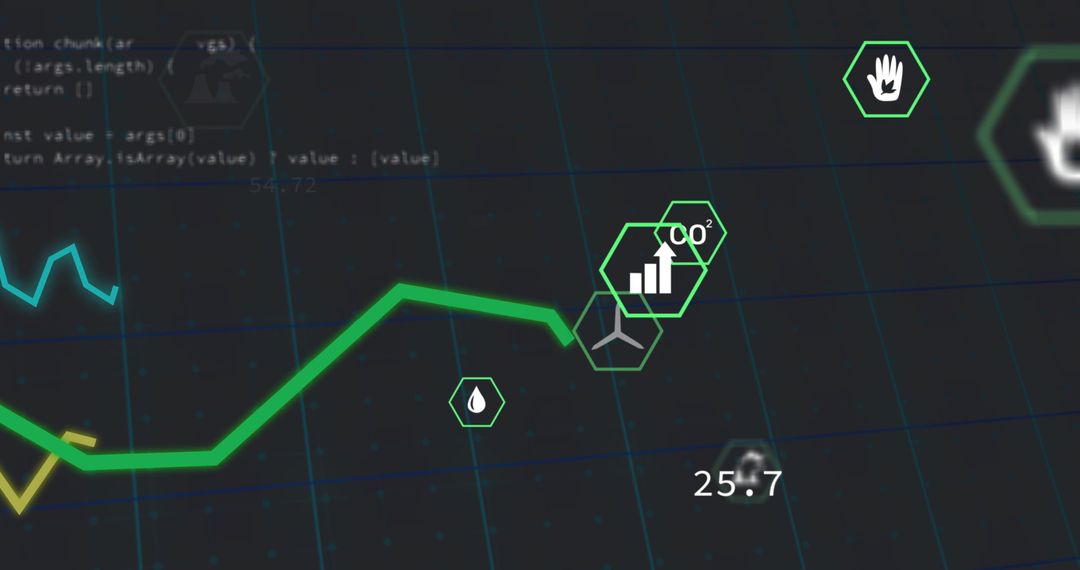
- Dynamic Green Line Graph on Digital Dashboard
Dynamic Green Line Graph on Digital Dashboard Image

Bright green zigzag line crosses digital dash with labels and iconography, showcasing analytics or finance trends in tech environment. Suitable for presentations on data analysis, quarterly reporting, or financial projections, illustrating growth trends and performance indicators.
Powered by  - Get 15% off with code: PIKWIZARD15


2
downloads
downloads
Tags:
More
Credit Photo
If you would like to credit the Photo, here are some ways you can do so
Text Link
photo Link
<span class="text-link">
<span>
<a target="_blank" href=https://pikwizard.com/photo/dynamic-green-line-graph-on-digital-dashboard/59911e740fef9340c9647e74614666be/>PikWizard</a>
</span>
</span>
<span class="image-link">
<span
style="margin: 0 0 20px 0; display: inline-block; vertical-align: middle; width: 100%;"
>
<a
target="_blank"
href="https://pikwizard.com/photo/dynamic-green-line-graph-on-digital-dashboard/59911e740fef9340c9647e74614666be/"
style="text-decoration: none; font-size: 10px; margin: 0;"
>
<img src="https://pikwizard.com/pw/medium/59911e740fef9340c9647e74614666be.jpg" style="margin: 0; width: 100%;" alt="" />
<p style="font-size: 12px; margin: 0;">PikWizard</p>
</a>
</span>
</span>
Free (free of charge)
Free for personal and commercial use.
Author: People Creations
Similar Free Stock Images

Premium


Premium


Premium


Premium


Premium


Premium


Premium


Premium


Premium


Premium


Premium


Premium


Premium


Premium


Premium


Premium


Premium


Premium


Premium


Premium


Premium


Premium


Premium


Premium

