- Home >
- Stock Photos >
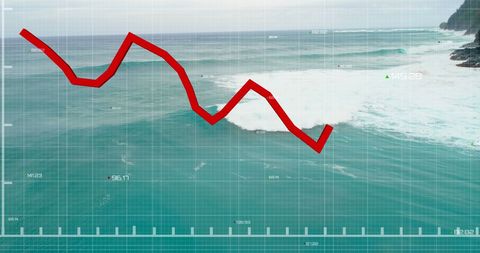
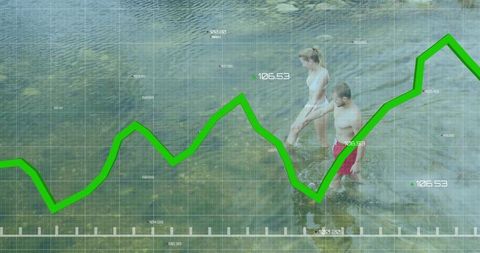
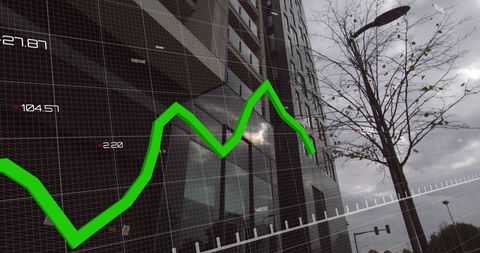
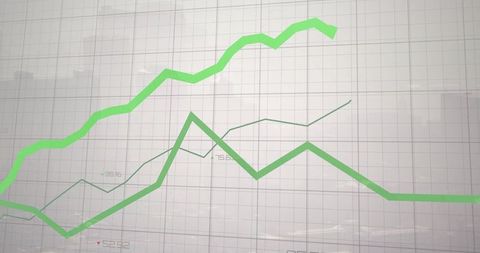
- Dynamic Green Line Graph Overlaying Abstract Grid Background
Dynamic Green Line Graph Overlaying Abstract Grid Background Image

Green financial graph against abstract background portrays economic growth or analysis. Suitable for illustrating financial trends in business presentations, investment publications, economic forecasts, or stock market analyses. Visualizes concepts of growth, investment ideas, and data tracking in an eye-catching manner.

downloads
Tags:
More
Credit Photo
If you would like to credit the Photo, here are some ways you can do so
Text Link
photo Link
<span class="text-link">
<span>
<a target="_blank" href=https://pikwizard.com/photo/dynamic-green-line-graph-overlaying-abstract-grid-background/031c0d2d44e75eb7b6d127831e5fe137/>PikWizard</a>
</span>
</span>
<span class="image-link">
<span
style="margin: 0 0 20px 0; display: inline-block; vertical-align: middle; width: 100%;"
>
<a
target="_blank"
href="https://pikwizard.com/photo/dynamic-green-line-graph-overlaying-abstract-grid-background/031c0d2d44e75eb7b6d127831e5fe137/"
style="text-decoration: none; font-size: 10px; margin: 0;"
>
<img src="https://pikwizard.com/pw/medium/031c0d2d44e75eb7b6d127831e5fe137.jpg" style="margin: 0; width: 100%;" alt="" />
<p style="font-size: 12px; margin: 0;">PikWizard</p>
</a>
</span>
</span>
Free (free of charge)
Free for personal and commercial use.
Author: Creative Art